 4
4peptides
spectra
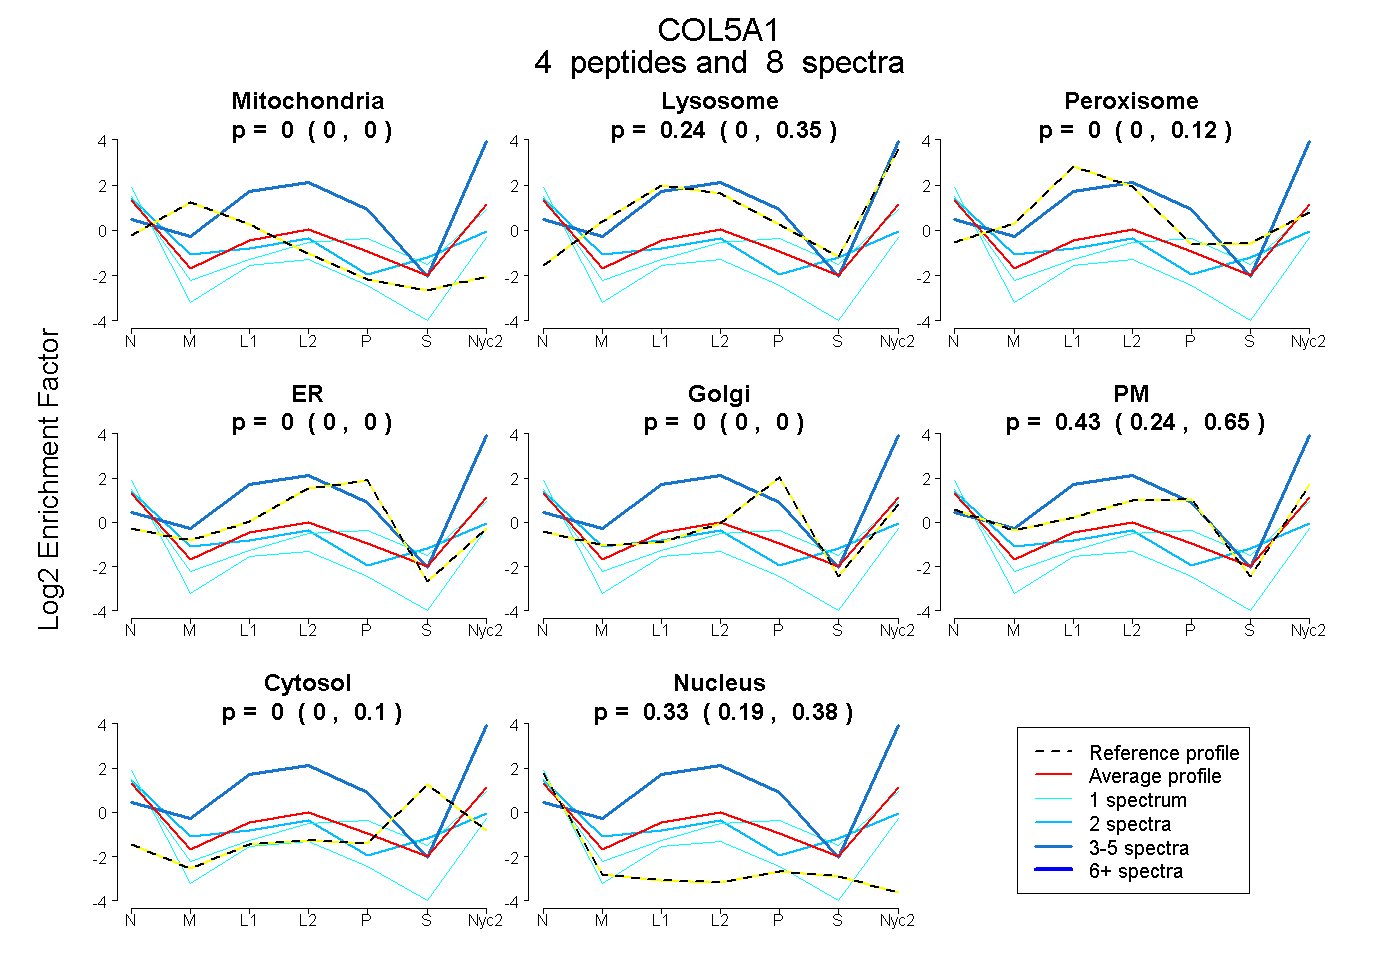
0.000 | 0.000
0.000 | 0.347
0.000 | 0.115
0.000 | 0.000
0.000 | 0.000
0.239 | 0.646
0.000 | 0.098
0.194 | 0.384
| Plot | Mito | Lyso | Perox | ER | Golgi | PM | Cytosol | Nucleus | |||||
| Expt A |
4 peptides |
8 spectra |
|
0.000 0.000 | 0.000 |
0.239 0.000 | 0.347 |
0.000 0.000 | 0.115 |
0.000 0.000 | 0.000 |
0.000 0.000 | 0.000 |
0.434 0.239 | 0.646 |
0.000 0.000 | 0.098 |
0.327 0.194 | 0.384 |
| 1 spectrum, GETGFQGK | 0.000 | 0.000 | 0.000 | 0.000 | 0.000 | 0.582 | 0.179 | 0.239 | ||
| 1 spectrum, GVQGPPGPTGKPGR | 0.000 | 0.007 | 0.000 | 0.000 | 0.000 | 0.376 | 0.000 | 0.617 | ||
| 4 spectra, RPLGTQQNPAR | 0.000 | 0.592 | 0.000 | 0.000 | 0.000 | 0.408 | 0.000 | 0.000 | ||
| 2 spectra, GEIGPPGPR | 0.000 | 0.163 | 0.236 | 0.000 | 0.000 | 0.106 | 0.054 | 0.441 |
| Plot | Mito | Lyso or Perox | ER | Golgi | PM | Cytosol | Nucleus | ||||||
| Expt B |
2 peptides |
3 spectra |
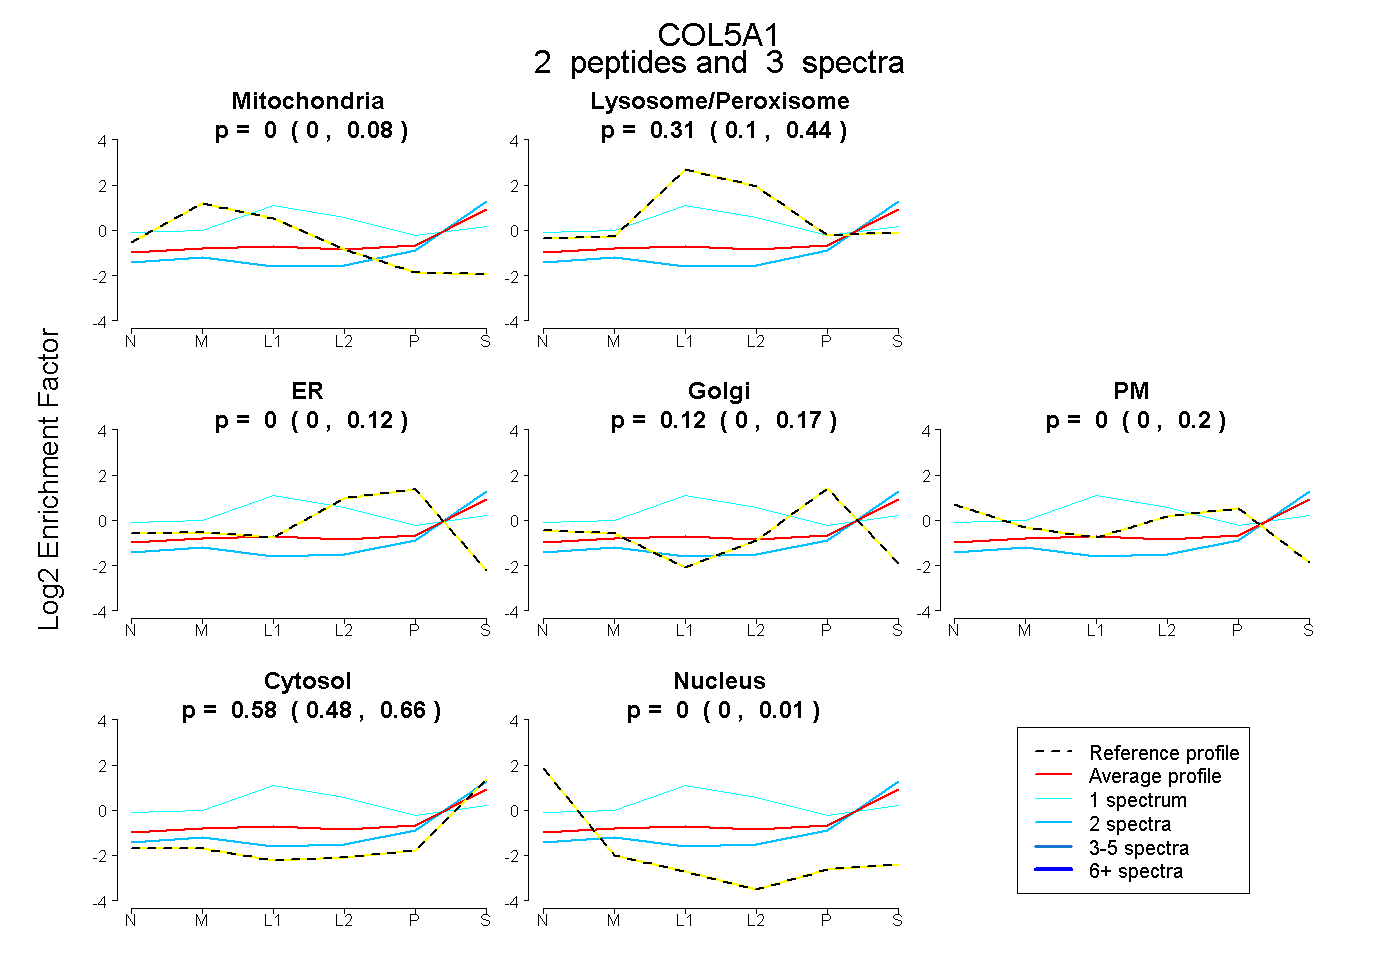 |
0.000 0.000 | 0.077 |
0.305 0.098 | 0.435 |
0.000 0.000 | 0.117 |
0.115 0.000 | 0.174 |
0.000 0.000 | 0.197 |
0.579 0.477 | 0.665 |
0.000 0.000 | 0.008 |
|||
| Plot | Lyso | Other | |||||||||||
| Expt C |
8 peptides |
9 spectra |
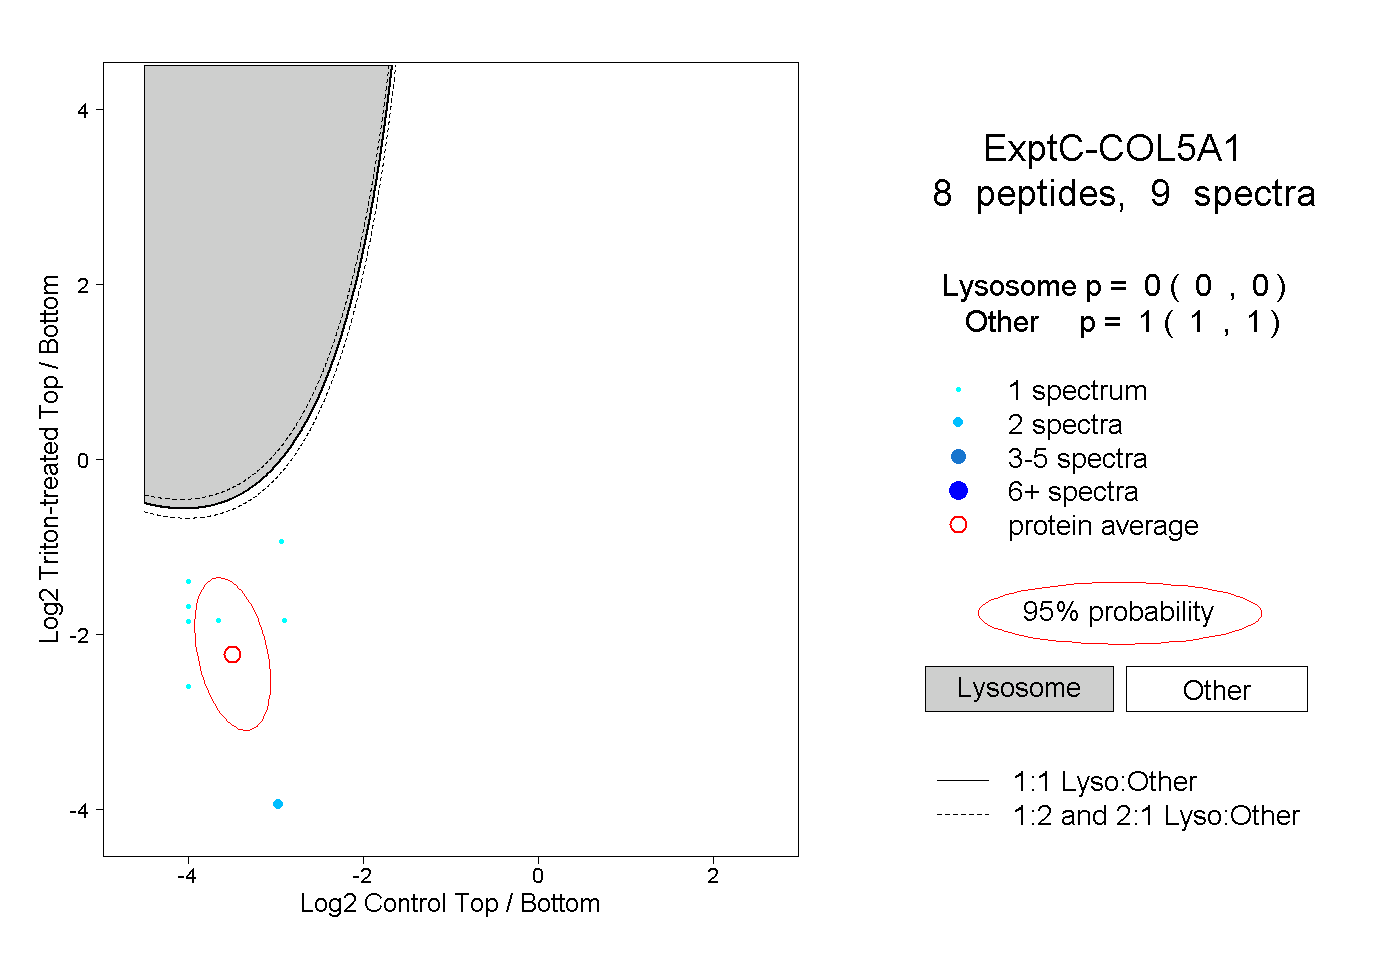 |
0.000 0.000 | 0.000 |
1.000 1.000 | 1.000 |
||||||||
| Plot | Lyso | Other | |||||||||||
| Expt D |
2 peptides |
3 spectra |
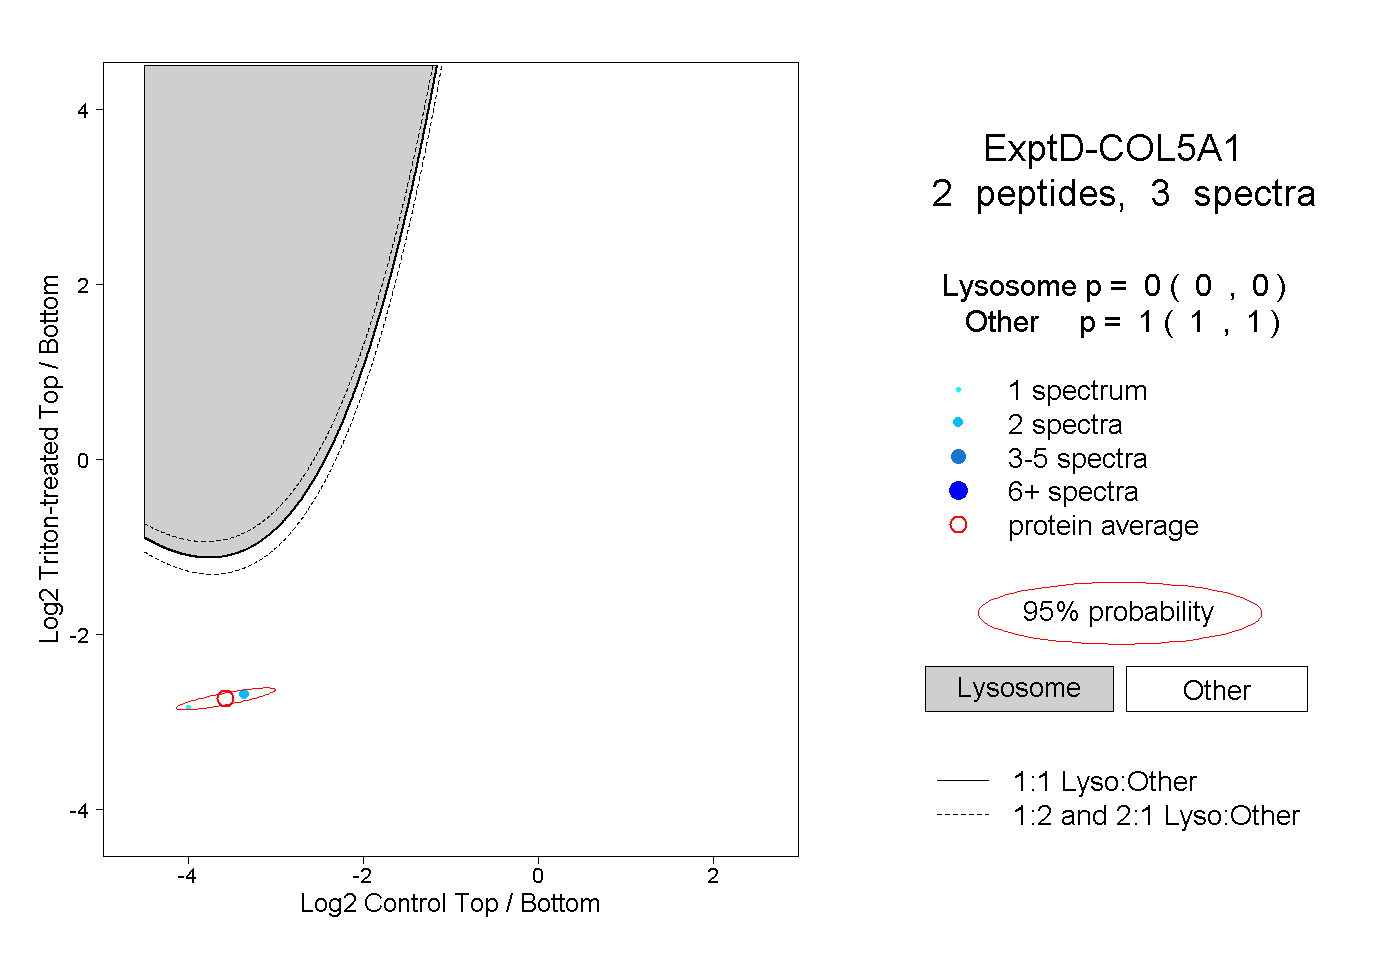 |
0.000 0.000 | 0.000 |
1.000 1.000 | 1.000 |