 6
6peptides
spectra
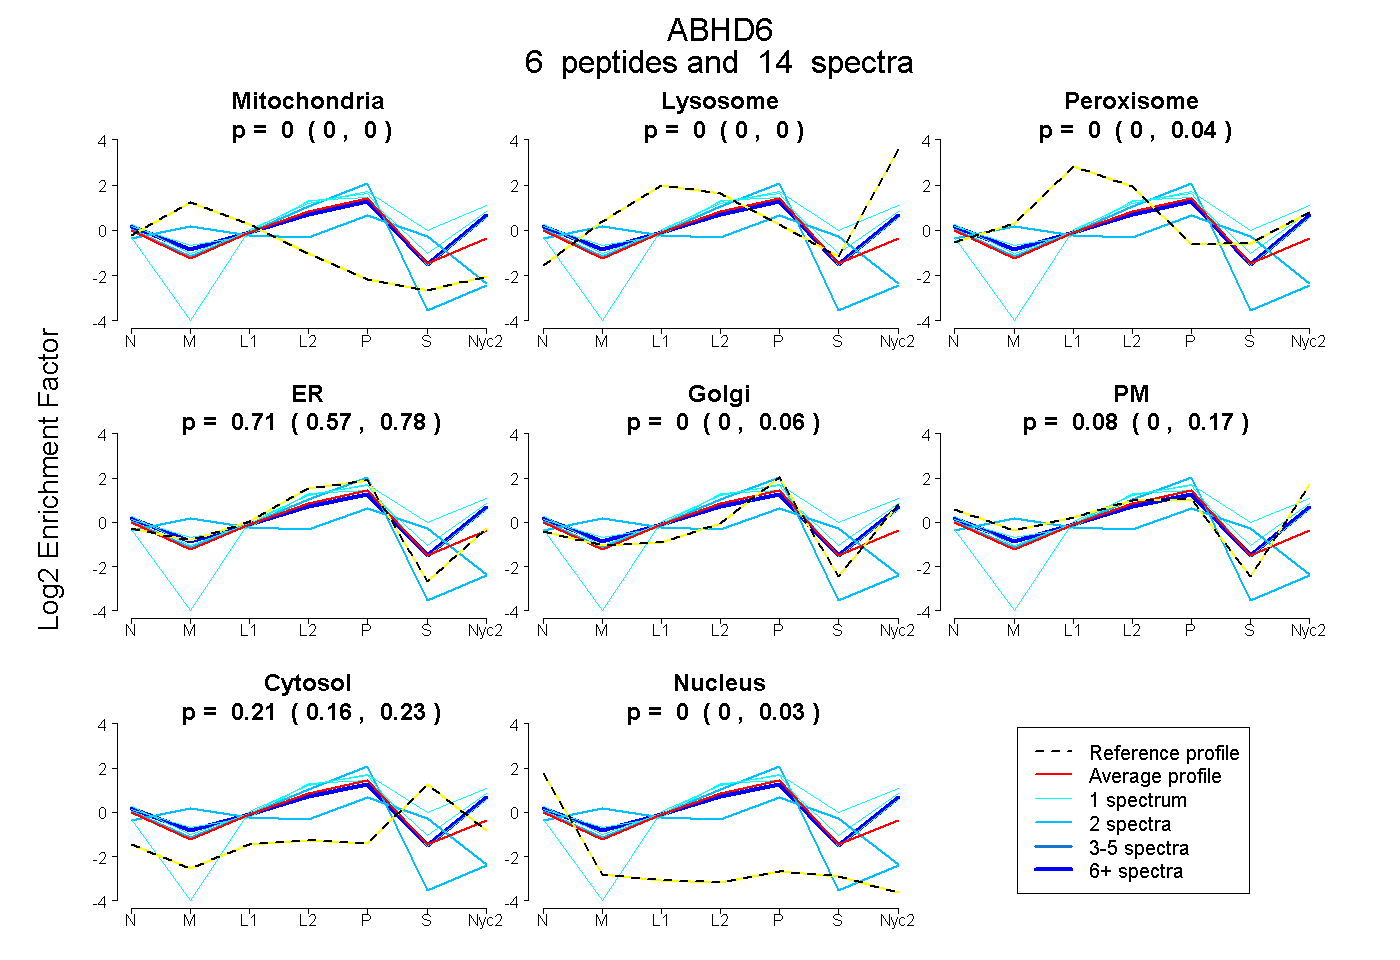
0.000 | 0.000
0.000 | 0.000
0.000 | 0.036
0.569 | 0.776
0.000 | 0.056
0.000 | 0.168
0.162 | 0.234
0.000 | 0.031
1peptide
spectra
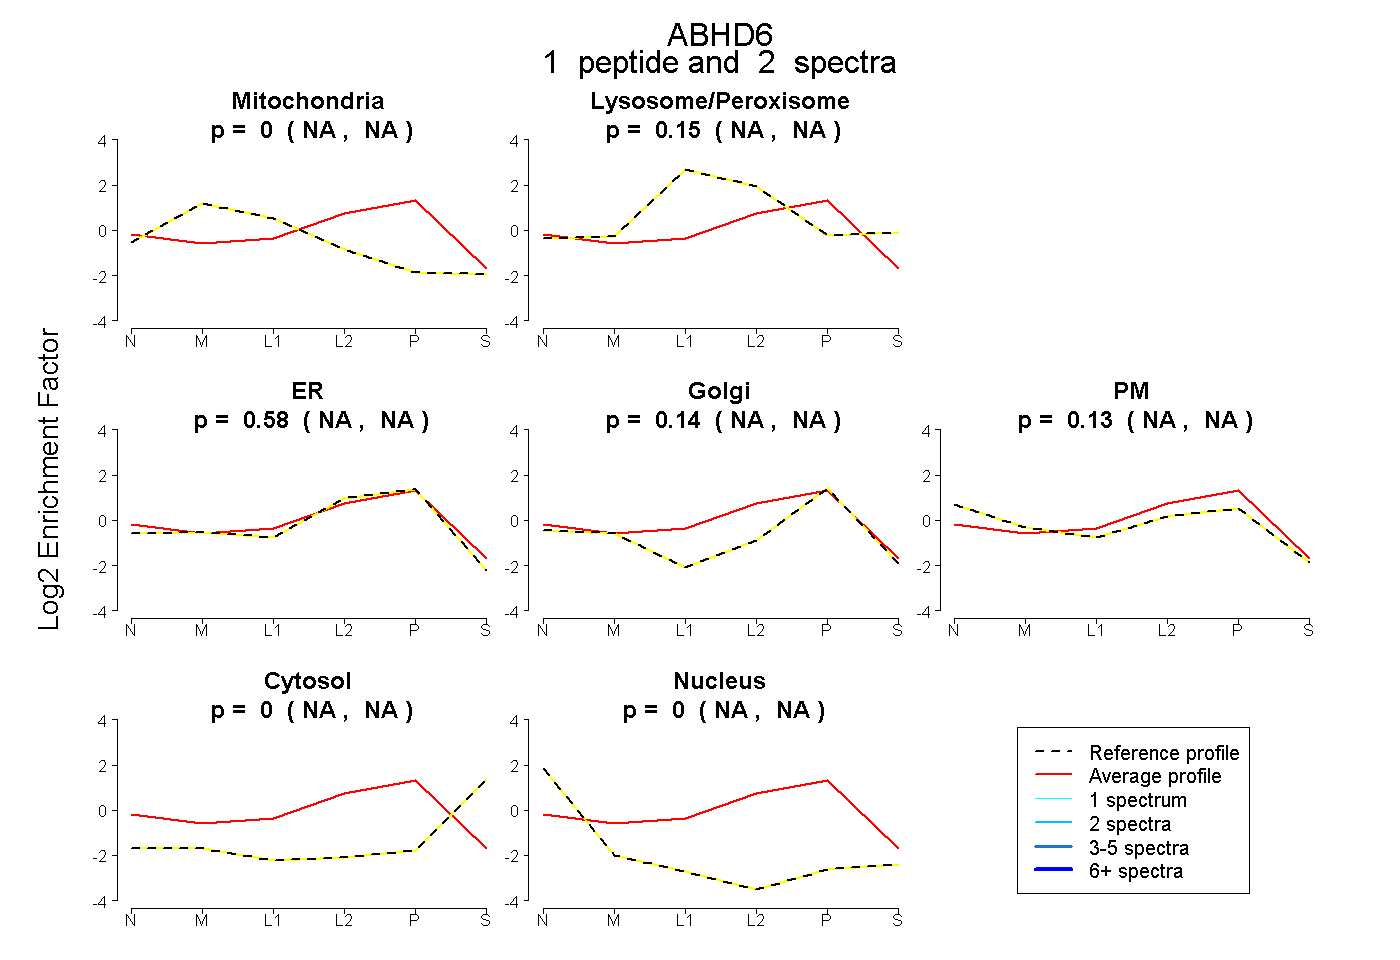
NA | NA
NA | NA
NA | NA
NA | NA
NA | NA
NA | NA
NA | NA
8peptides
spectra
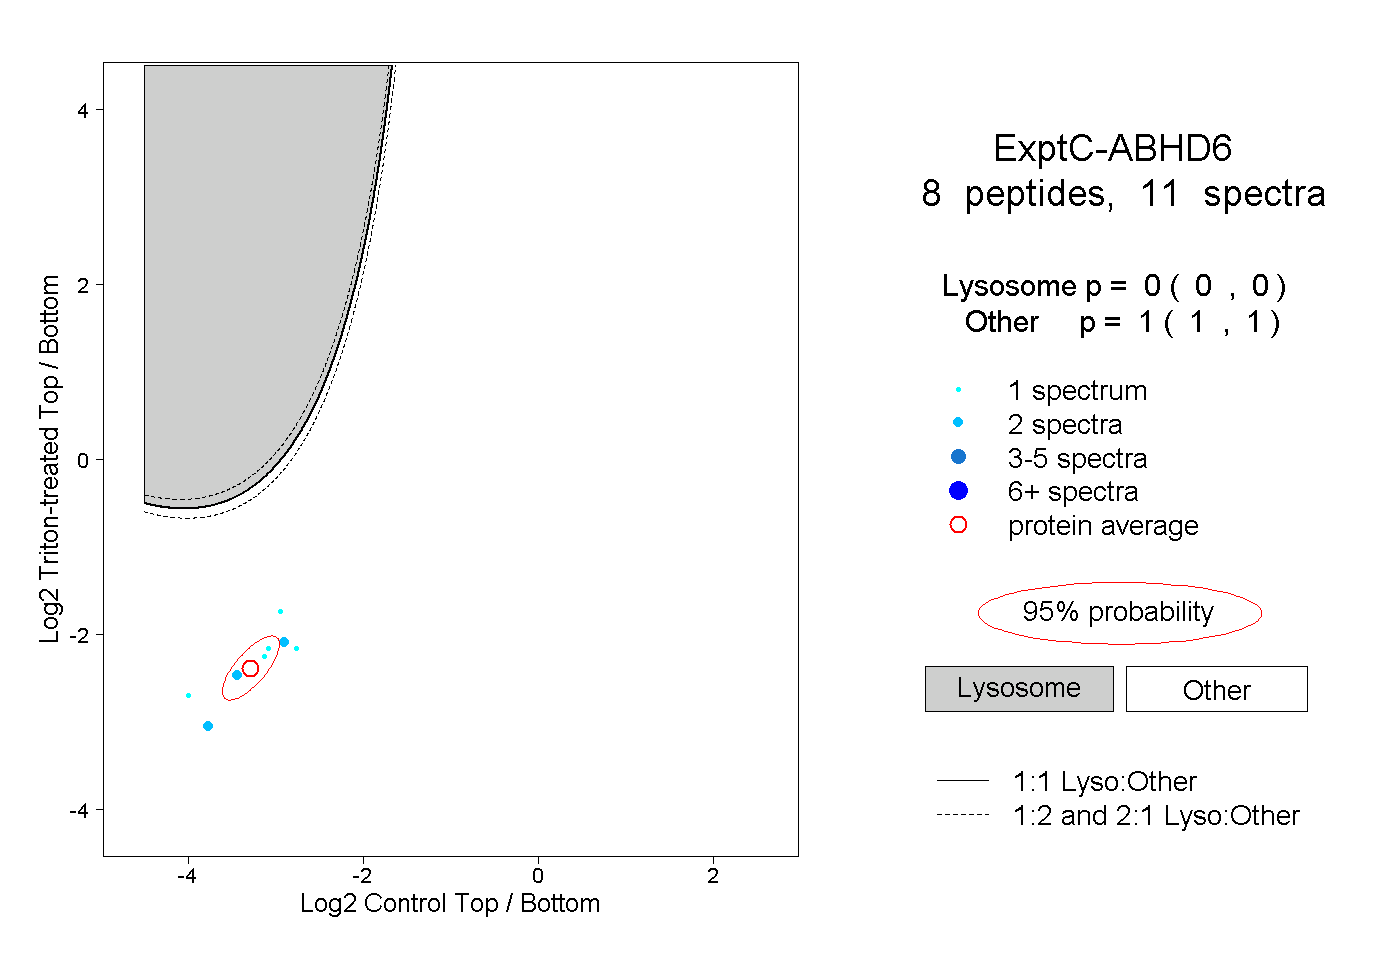
0.000 | 0.000
1.000 | 1.000
1peptide
spectra
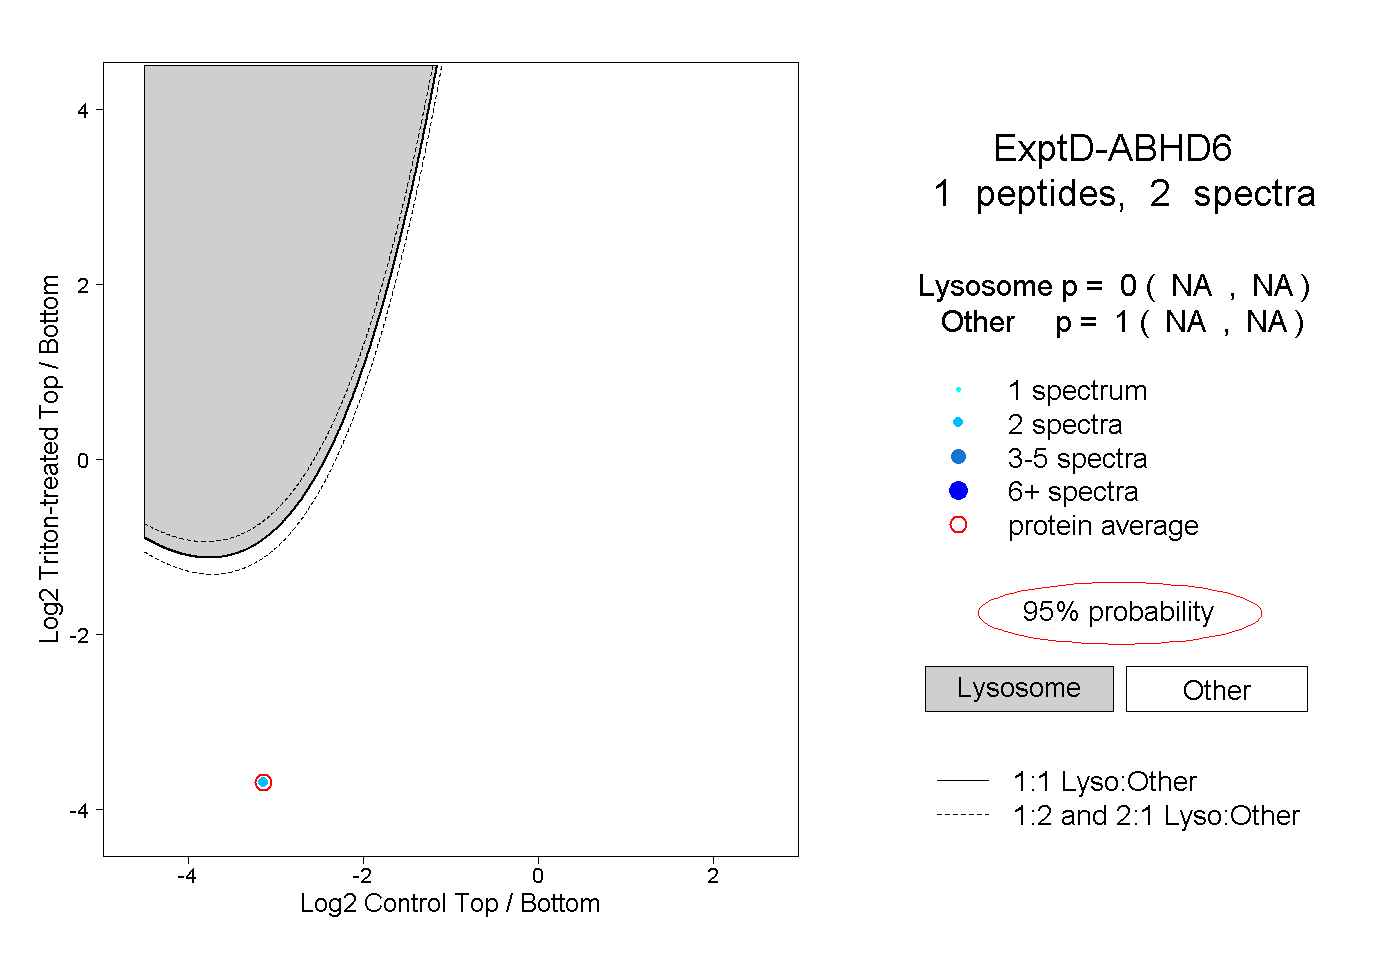
NA | NA
NA | NA