 6
6peptides
spectra
0.000 | 0.000
0.000 | 0.000
0.000 | 0.036
0.569 | 0.776
0.000 | 0.056
0.000 | 0.168
0.162 | 0.234
0.000 | 0.031
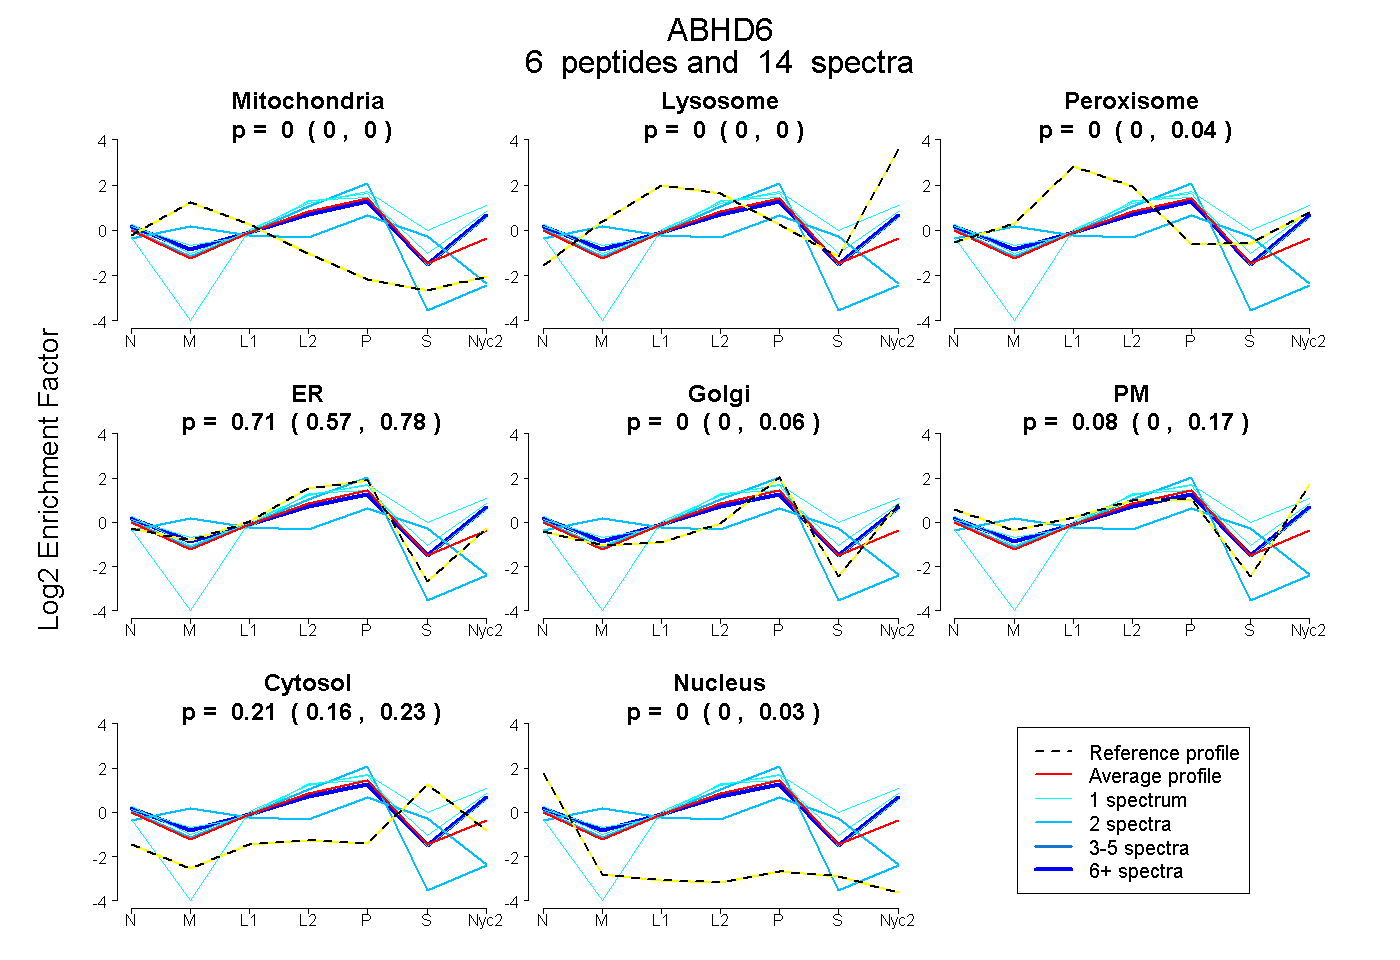
| Plot | Mito | Lyso | Perox | ER | Golgi | PM | Cytosol | Nucleus | |||||
| Expt A |
6 peptides |
14 spectra |
|
0.000 0.000 | 0.000 |
0.000 0.000 | 0.000 |
0.000 0.000 | 0.036 |
0.708 0.569 | 0.776 |
0.000 0.000 | 0.056 |
0.078 0.000 | 0.168 |
0.214 0.162 | 0.234 |
0.000 0.000 | 0.031 |
| 1 spectrum, VPQQILQGLVDVR | 0.000 | 0.126 | 0.000 | 0.352 | 0.152 | 0.000 | 0.370 | 0.000 | ||
| 1 spectrum, TLGMQVR | 0.000 | 0.000 | 0.000 | 0.485 | 0.000 | 0.403 | 0.112 | 0.000 | ||
| 2 spectra, LFLEIVSEK | 0.000 | 0.000 | 0.000 | 0.848 | 0.000 | 0.000 | 0.000 | 0.152 | ||
| 1 spectrum, IHQFVECLK | 0.000 | 0.076 | 0.000 | 0.360 | 0.000 | 0.408 | 0.156 | 0.000 | ||
| 7 spectra, DMWLSVVK | 0.000 | 0.000 | 0.045 | 0.232 | 0.150 | 0.426 | 0.147 | 0.000 | ||
| 2 spectra, QDQVLDVSGADILAK | 0.325 | 0.000 | 0.000 | 0.361 | 0.000 | 0.000 | 0.314 | 0.000 |
| Plot | Mito | Lyso or Perox | ER | Golgi | PM | Cytosol | Nucleus | ||||||
| Expt B |
1 peptide |
2 spectra |
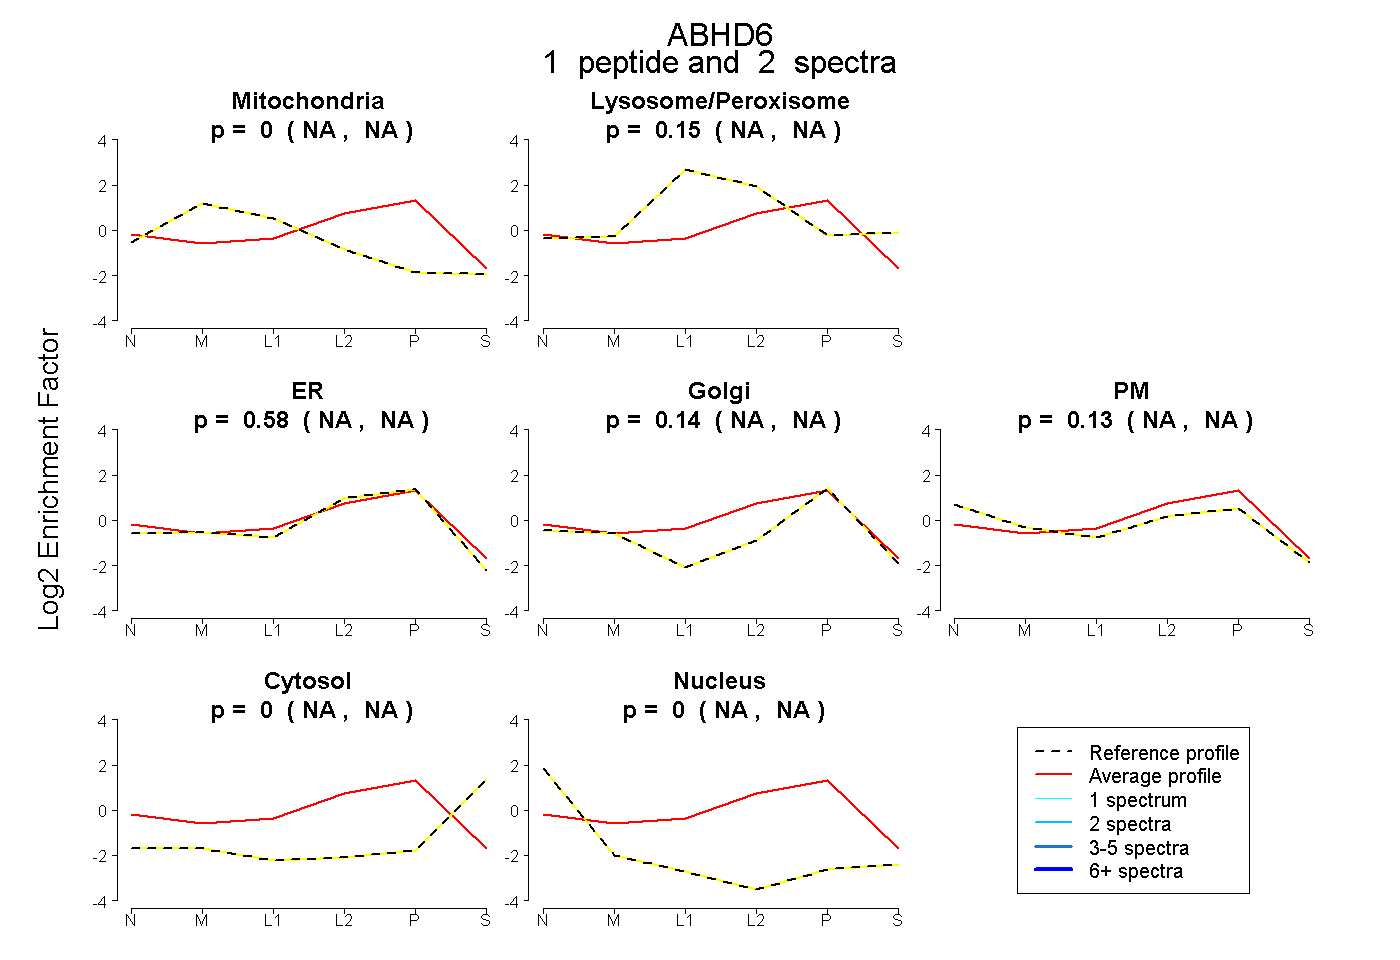 |
0.000 NA | NA |
0.147 NA | NA |
0.584 NA | NA |
0.137 NA | NA |
0.132 NA | NA |
0.000 NA | NA |
0.000 NA | NA |
|||
| Plot | Lyso | Other | |||||||||||
| Expt C |
8 peptides |
11 spectra |
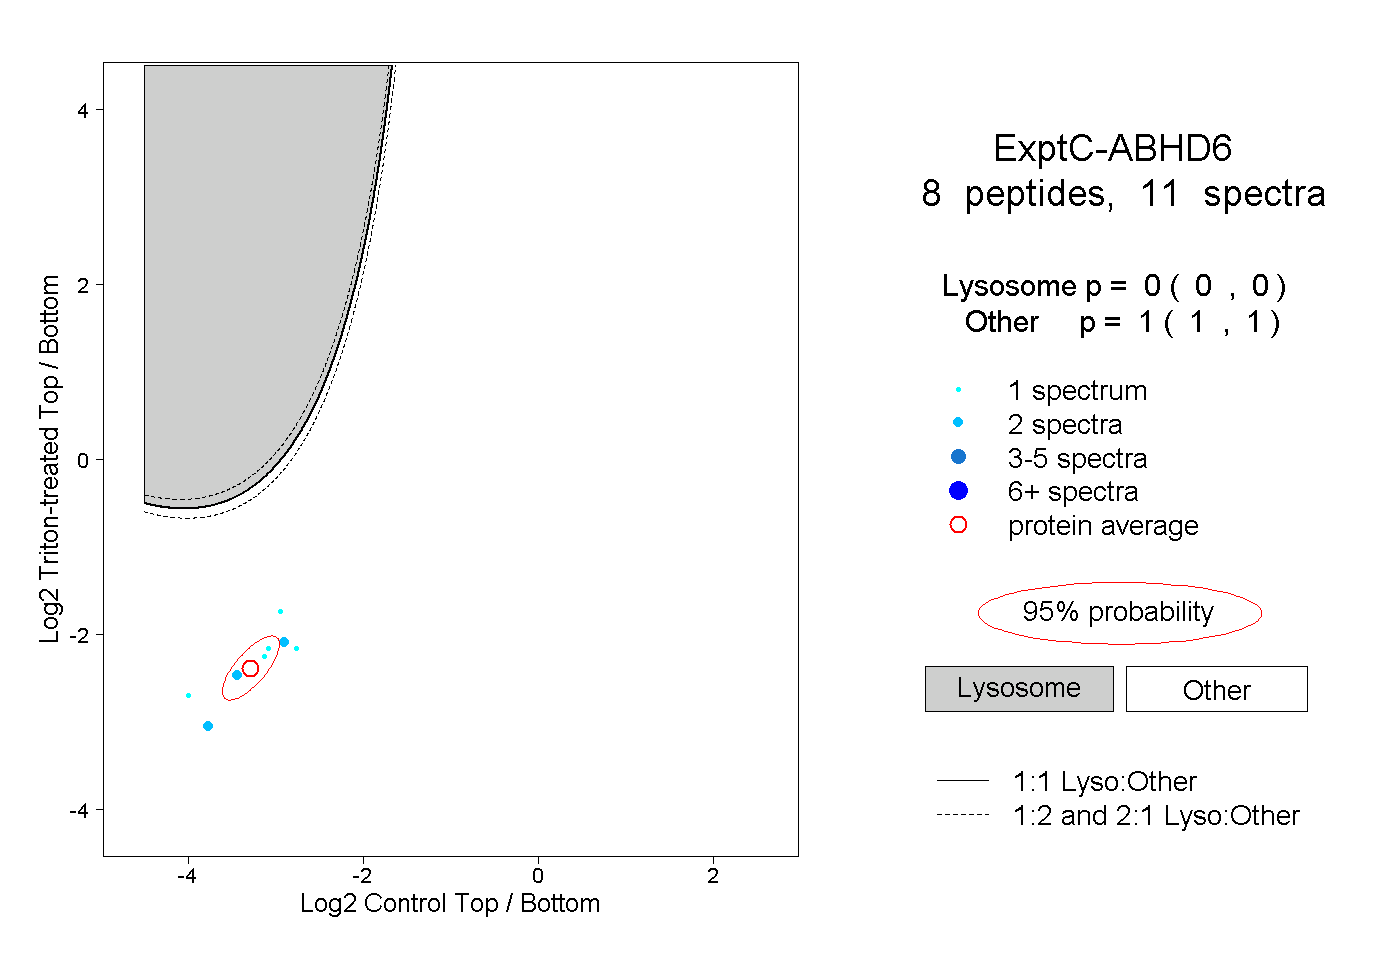 |
0.000 0.000 | 0.000 |
1.000 1.000 | 1.000 |
||||||||
| Plot | Lyso | Other | |||||||||||
| Expt D |
1 peptide |
2 spectra |
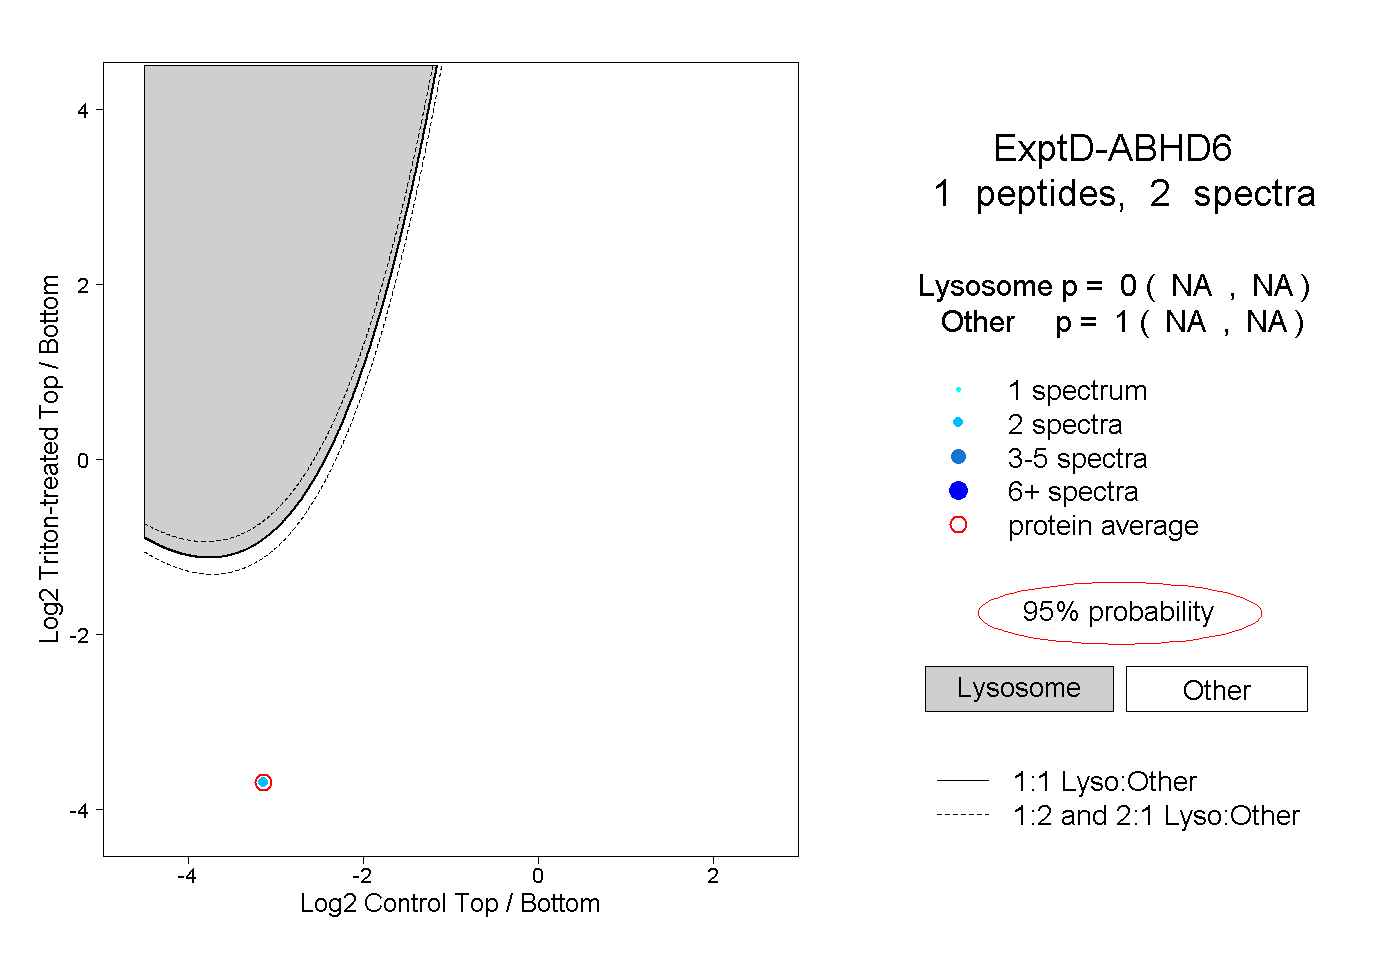 |
0.000 NA | NA |
1.000 NA | NA |