 22
22peptides
spectra
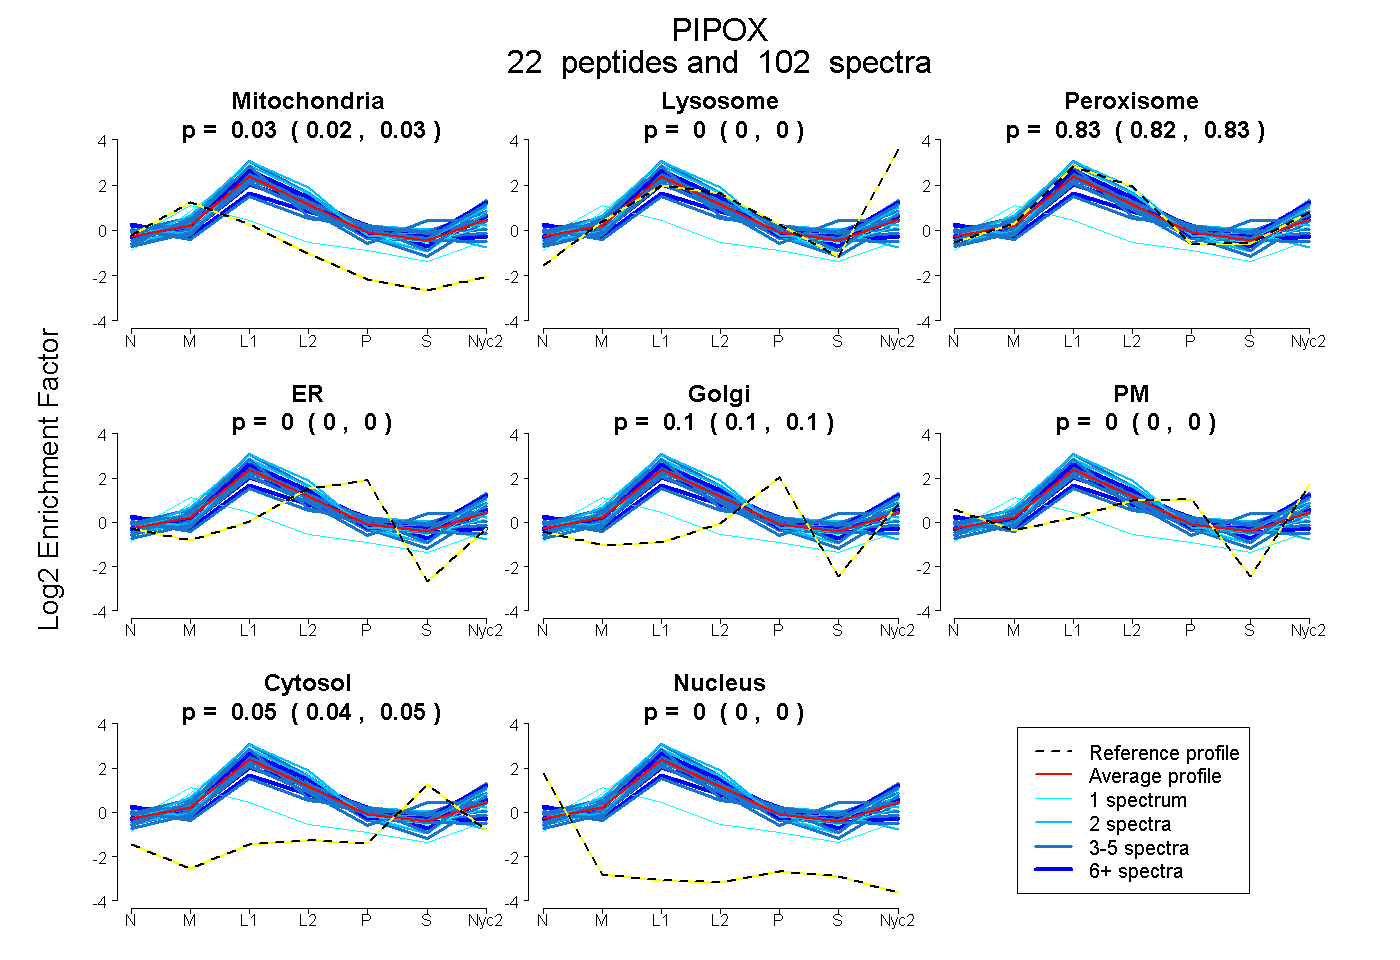
0.024 | 0.030
0.000 | 0.000
0.821 | 0.829
0.000 | 0.000
0.097 | 0.103
0.000 | 0.000
0.044 | 0.050
0.000 | 0.000
18peptides
spectra
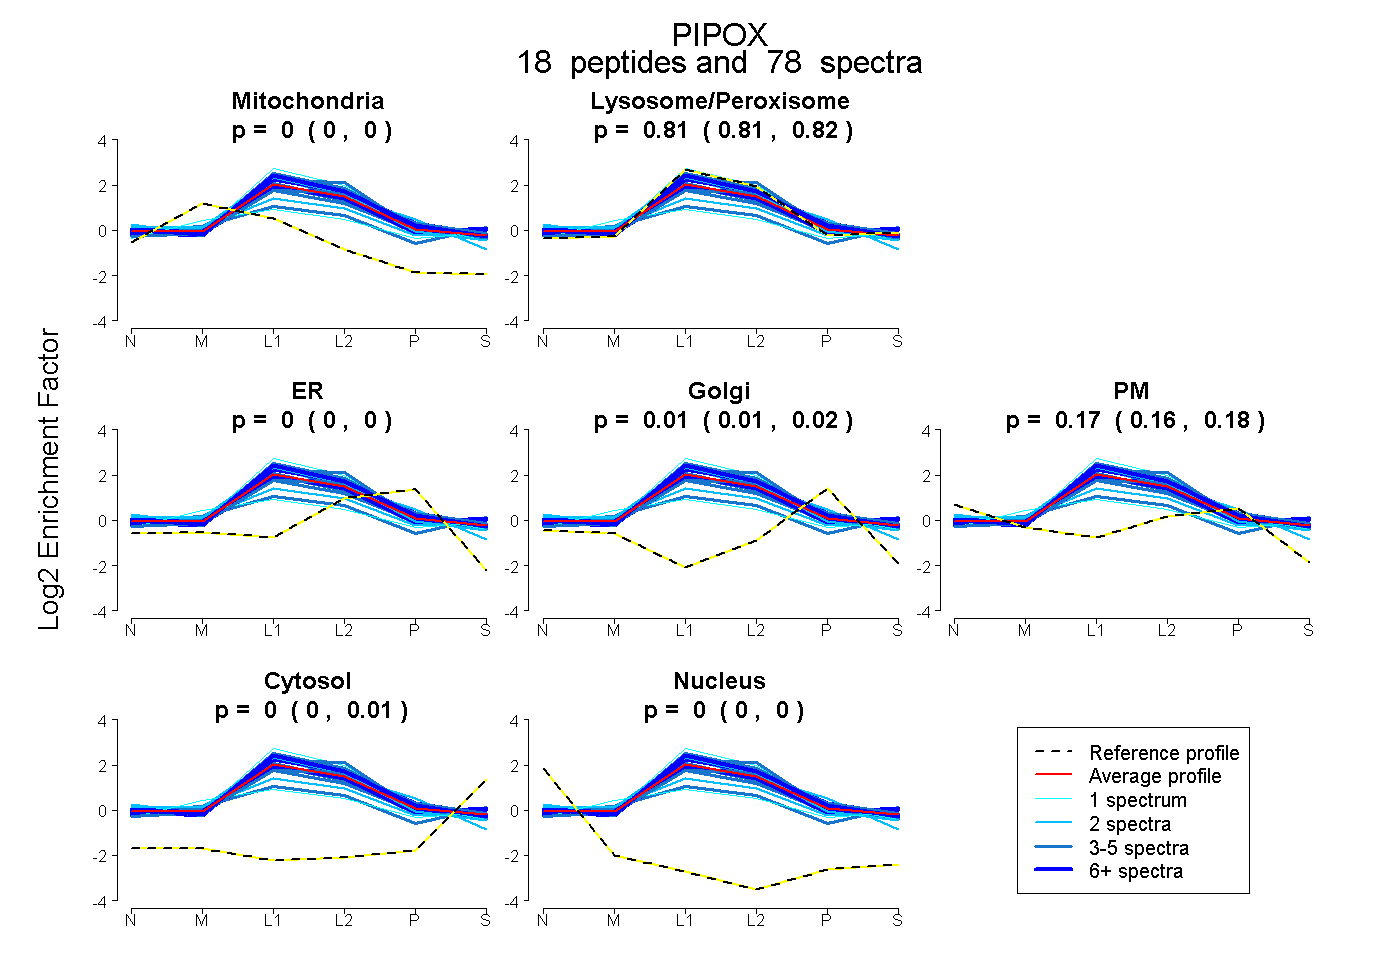
0.000 | 0.000
0.806 | 0.815
0.000 | 0.000
0.006 | 0.020
0.163 | 0.178
0.001 | 0.007
0.000 | 0.000
25peptides
spectra
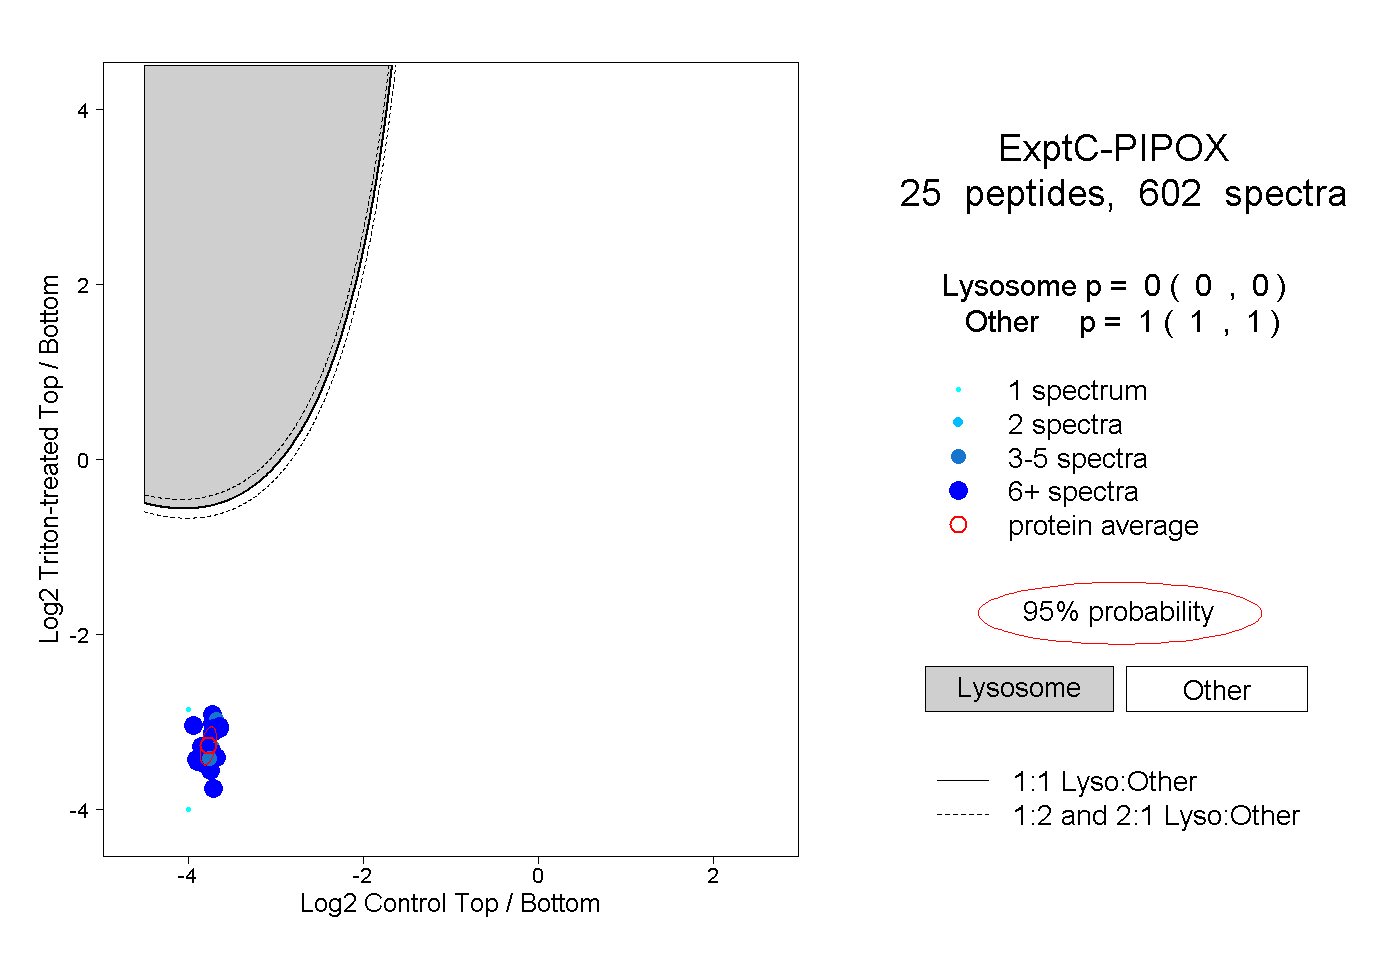
0.000 | 0.000
1.000 | 1.000
14peptides
spectra
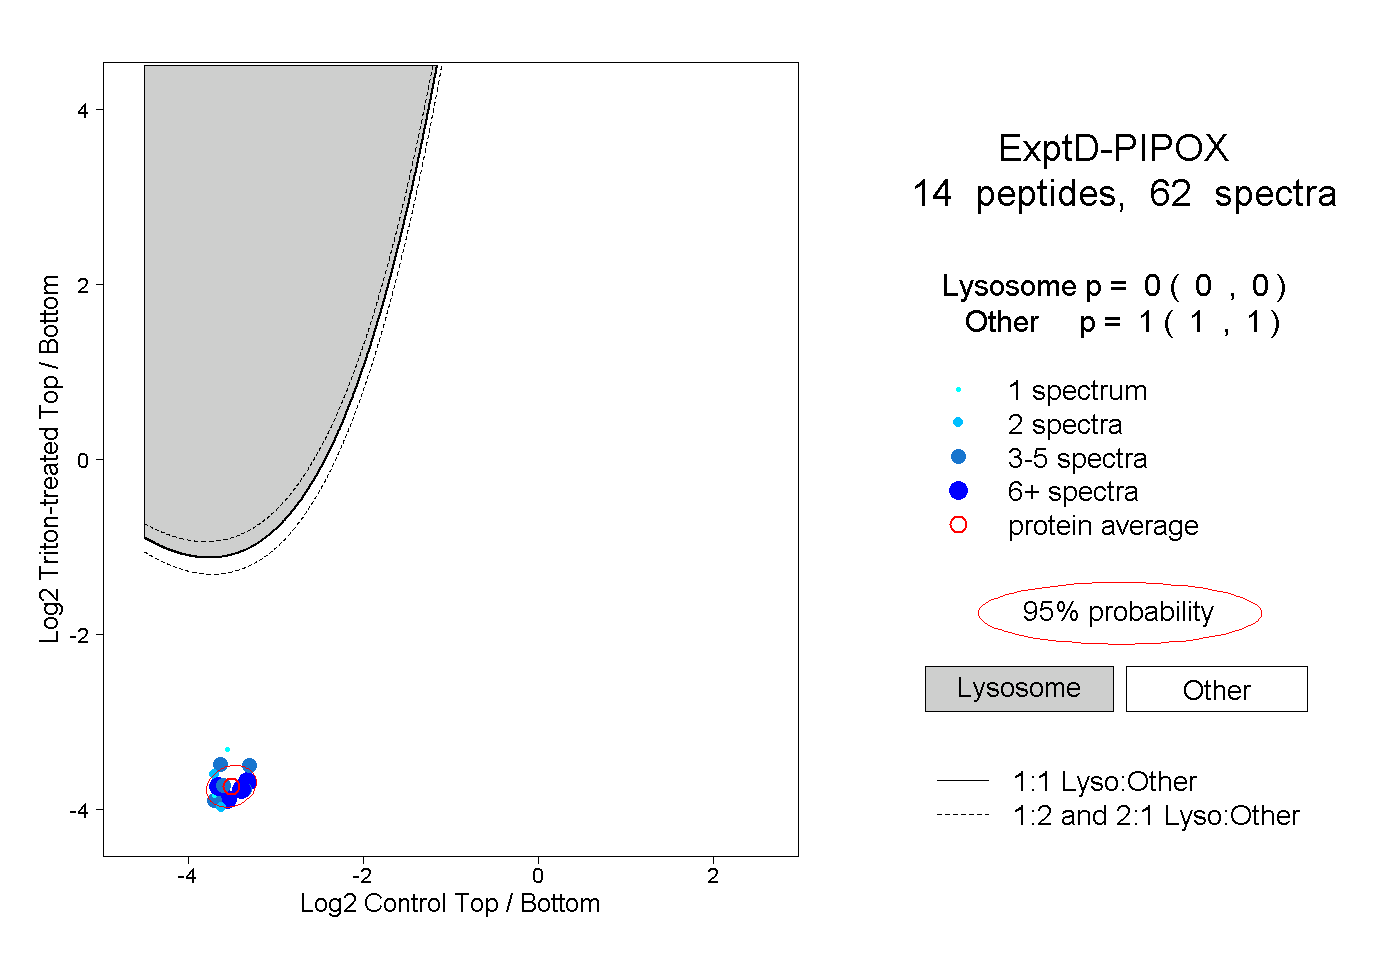
0.000 | 0.000
1.000 | 1.000