 22
22peptides
spectra
0.024 | 0.030
0.000 | 0.000
0.821 | 0.829
0.000 | 0.000
0.097 | 0.103
0.000 | 0.000
0.044 | 0.050
0.000 | 0.000
| Plot | Mito | Lyso | Perox | ER | Golgi | PM | Cytosol | Nucleus | |||||
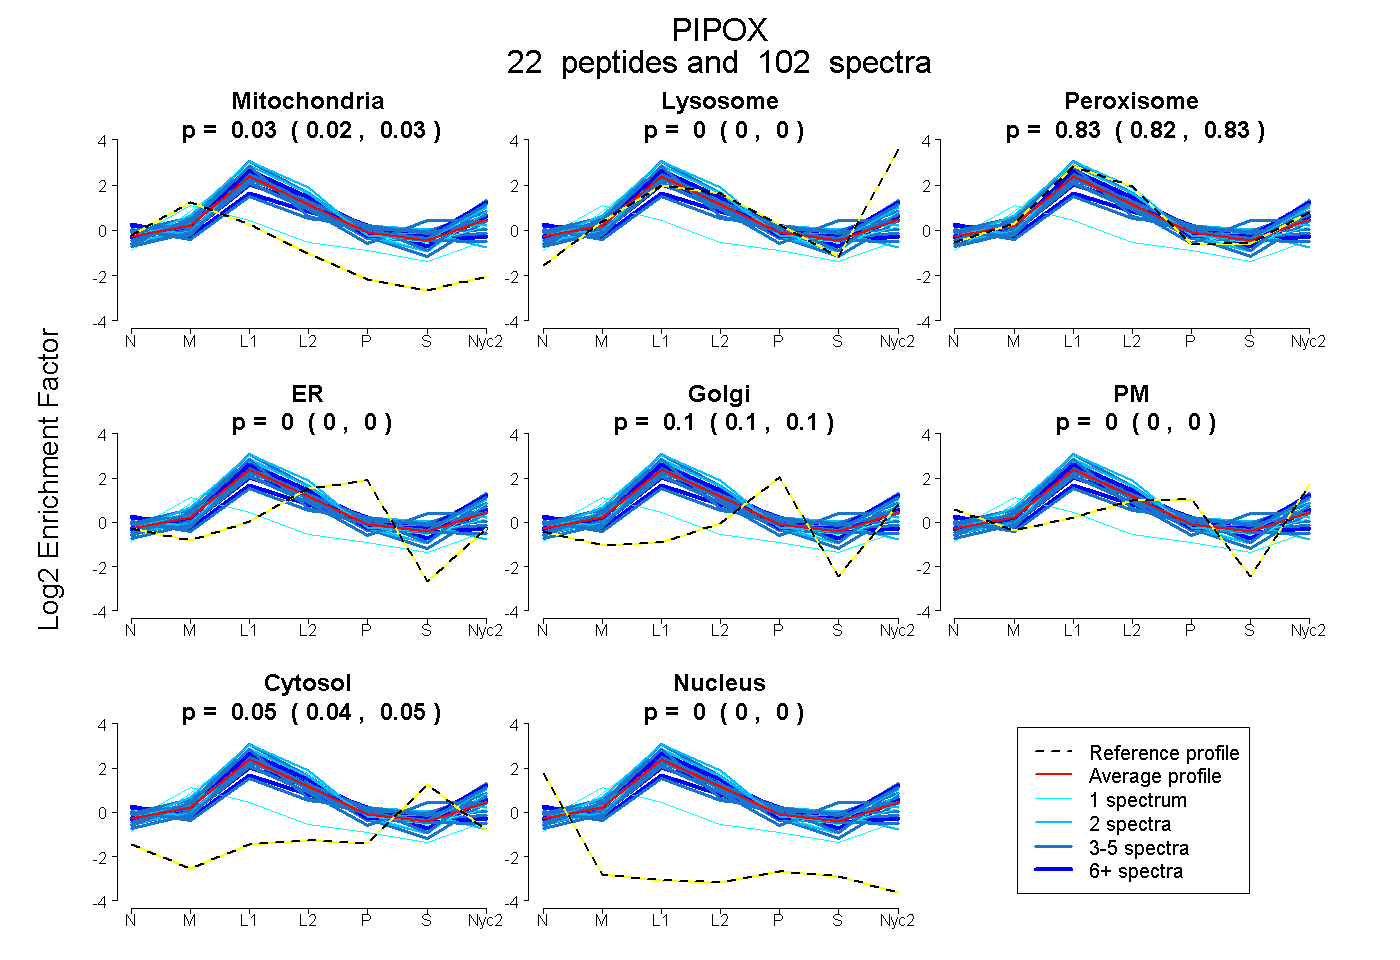
| Expt A |
22 peptides |
102 spectra |
|
0.028 0.024 | 0.030 |
0.000 0.000 | 0.000 |
0.825 0.821 | 0.829 |
0.000 0.000 | 0.000 |
0.100 0.097 | 0.103 |
0.000 0.000 | 0.000 |
0.047 0.044 | 0.050 |
0.000 0.000 | 0.000 |
| 4 spectra, LPPSYDLAPFR | 0.000 | 0.000 | 0.810 | 0.000 | 0.072 | 0.029 | 0.089 | 0.000 | ||
| 9 spectra, INVCYWR | 0.064 | 0.000 | 0.776 | 0.132 | 0.000 | 0.000 | 0.028 | 0.000 | ||
| 2 spectra, QGIDHECLSSVHLK | 0.000 | 0.000 | 0.882 | 0.000 | 0.000 | 0.000 | 0.026 | 0.092 | ||
| 5 spectra, GEVGLLDK | 0.148 | 0.000 | 0.715 | 0.000 | 0.000 | 0.137 | 0.000 | 0.000 | ||
| 4 spectra, AYPEDFYTR | 0.000 | 0.000 | 0.903 | 0.000 | 0.000 | 0.049 | 0.011 | 0.037 | ||
| 2 spectra, VVEIRPGLPVTVK | 0.000 | 0.034 | 0.917 | 0.000 | 0.000 | 0.049 | 0.000 | 0.000 | ||
| 5 spectra, YDNIVIGAGFSGHGFK | 0.040 | 0.152 | 0.734 | 0.000 | 0.030 | 0.000 | 0.043 | 0.000 | ||
| 5 spectra, VCYHHGDSVDPEER | 0.000 | 0.000 | 0.571 | 0.000 | 0.124 | 0.106 | 0.199 | 0.000 | ||
| 9 spectra, DHLPGLRPEPDIMER | 0.000 | 0.000 | 0.610 | 0.000 | 0.034 | 0.190 | 0.139 | 0.028 | ||
| 3 spectra, TWAQLER | 0.000 | 0.000 | 0.767 | 0.000 | 0.000 | 0.000 | 0.233 | 0.000 | ||
| 8 spectra, TIQATLSR | 0.000 | 0.121 | 0.819 | 0.000 | 0.000 | 0.027 | 0.033 | 0.000 | ||
| 19 spectra, ALQHVIR | 0.000 | 0.000 | 0.724 | 0.000 | 0.123 | 0.115 | 0.001 | 0.037 | ||
| 4 spectra, CMYTNTPDEHFILDCHPK | 0.010 | 0.000 | 0.724 | 0.072 | 0.038 | 0.000 | 0.155 | 0.000 | ||
| 1 spectrum, QLGGMVCDGEK | 0.057 | 0.000 | 0.900 | 0.042 | 0.000 | 0.000 | 0.000 | 0.000 | ||
| 4 spectra, TFSDIQDVQILCHFVK | 0.094 | 0.000 | 0.886 | 0.020 | 0.000 | 0.000 | 0.000 | 0.000 | ||
| 4 spectra, VLYELSMK | 0.000 | 0.023 | 0.698 | 0.000 | 0.027 | 0.253 | 0.000 | 0.000 | ||
| 2 spectra, LAPAVGK | 0.000 | 0.000 | 0.797 | 0.047 | 0.037 | 0.000 | 0.119 | 0.000 | ||
| 2 spectra, TGGVLYADK | 0.000 | 0.090 | 0.893 | 0.000 | 0.000 | 0.018 | 0.000 | 0.000 | ||
| 1 spectrum, ENPGLK | 0.583 | 0.198 | 0.057 | 0.000 | 0.077 | 0.000 | 0.085 | 0.000 | ||
| 5 spectra, MMDECYR | 0.113 | 0.000 | 0.833 | 0.000 | 0.000 | 0.000 | 0.054 | 0.000 | ||
| 1 spectrum, TELLFLGMK | 0.037 | 0.121 | 0.820 | 0.022 | 0.000 | 0.000 | 0.000 | 0.000 | ||
| 3 spectra, EAGAQLHR | 0.000 | 0.117 | 0.771 | 0.000 | 0.013 | 0.085 | 0.014 | 0.000 |
| Plot | Mito | Lyso or Perox | ER | Golgi | PM | Cytosol | Nucleus | ||||||
| Expt B |
18 peptides |
78 spectra |
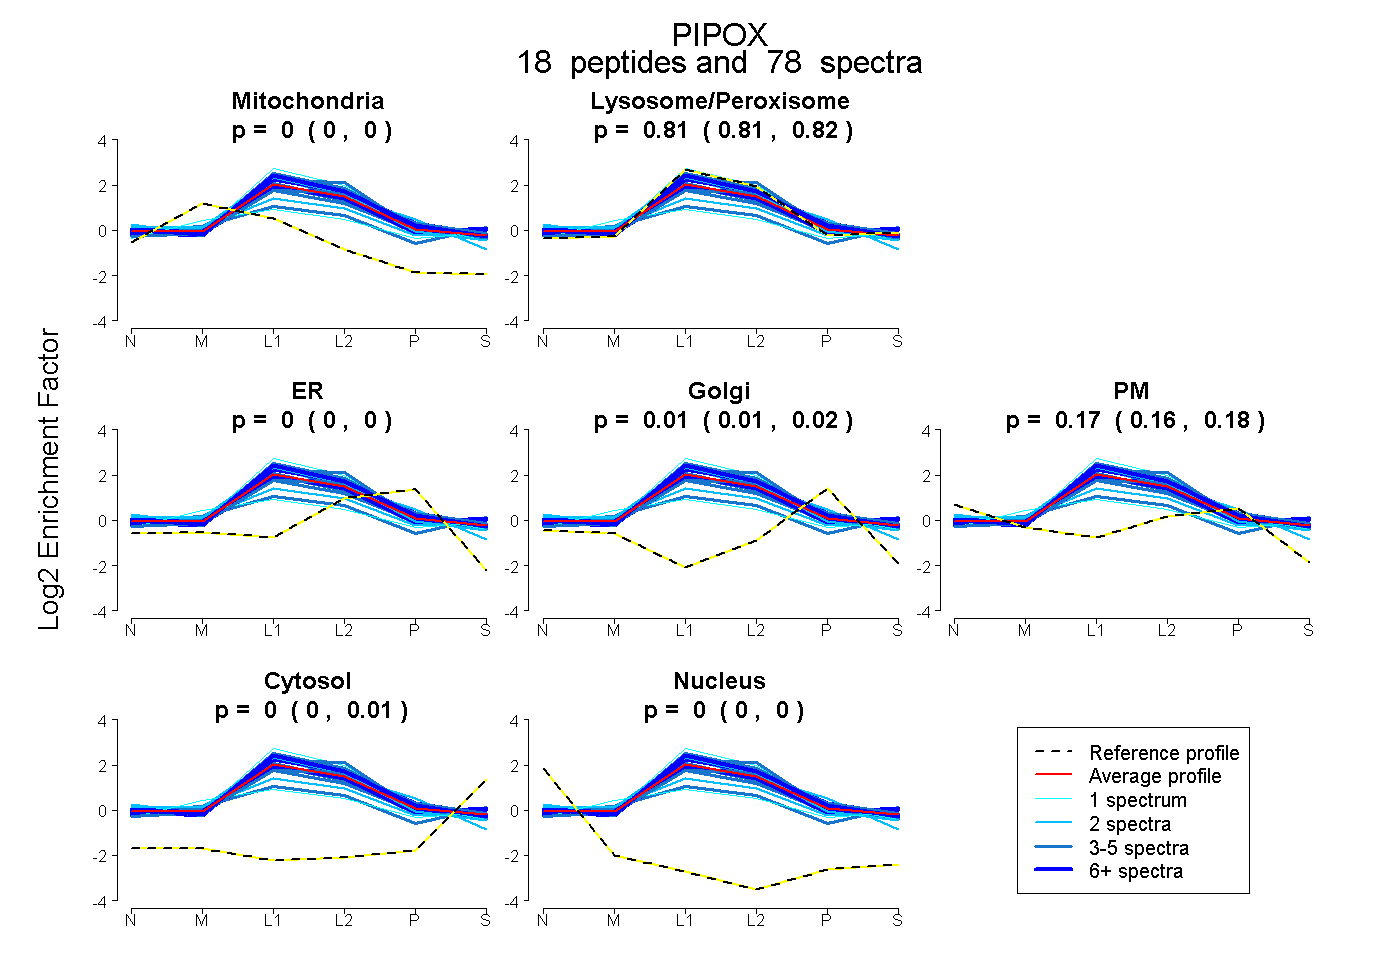 |
0.000 0.000 | 0.000 |
0.811 0.806 | 0.815 |
0.000 0.000 | 0.000 |
0.014 0.006 | 0.020 |
0.171 0.163 | 0.178 |
0.004 0.001 | 0.007 |
0.000 0.000 | 0.000 |
|||
| Plot | Lyso | Other | |||||||||||
| Expt C |
25 peptides |
602 spectra |
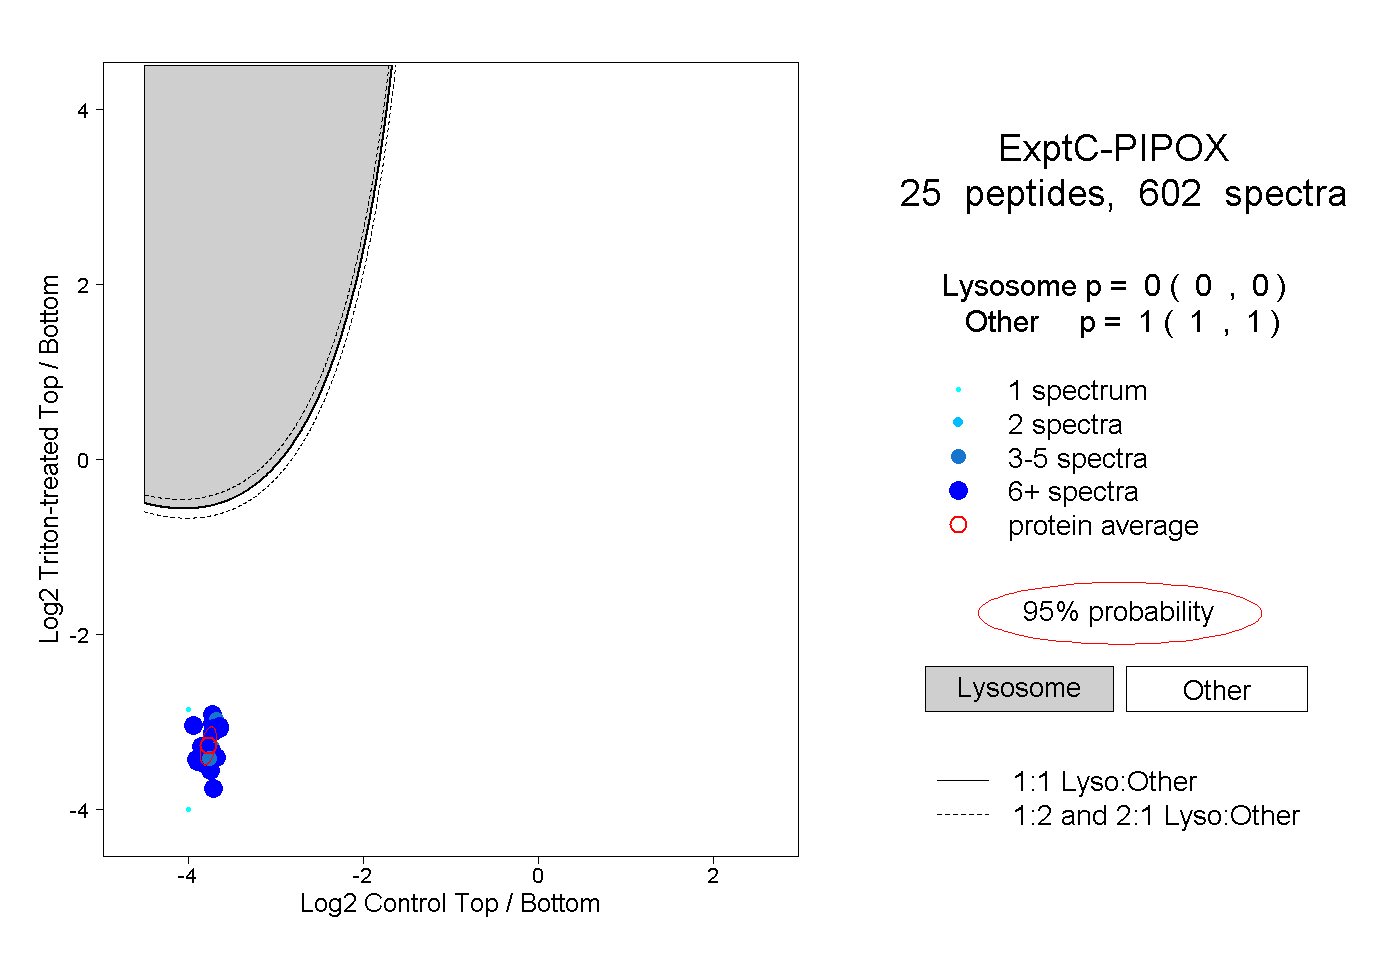 |
0.000 0.000 | 0.000 |
1.000 1.000 | 1.000 |
||||||||
| Plot | Lyso | Other | |||||||||||
| Expt D |
14 peptides |
62 spectra |
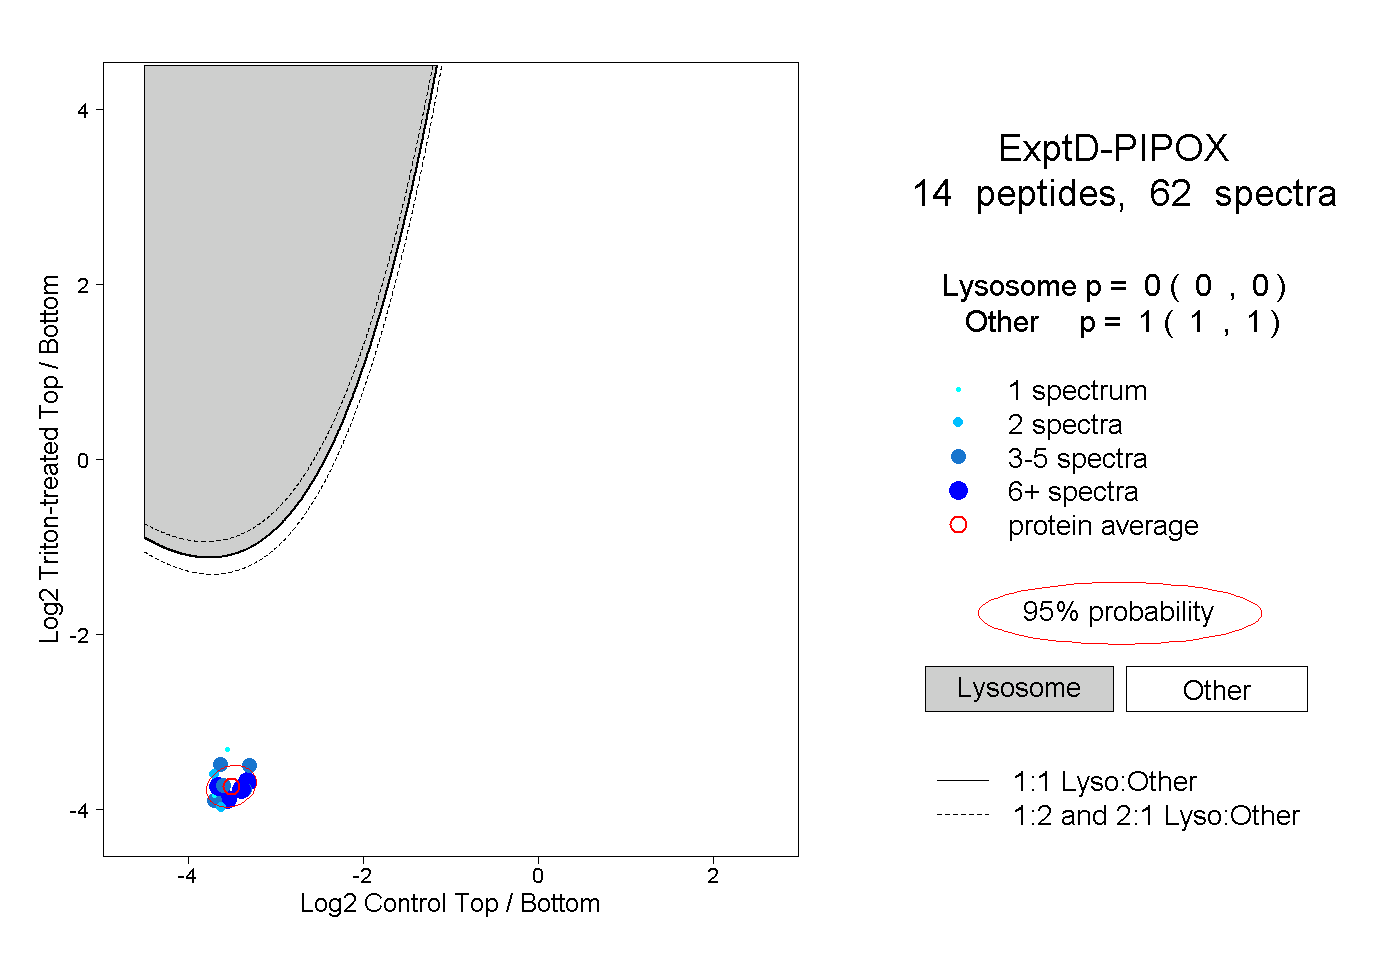 |
0.000 0.000 | 0.000 |
1.000 1.000 | 1.000 |