 13
13peptides
spectra
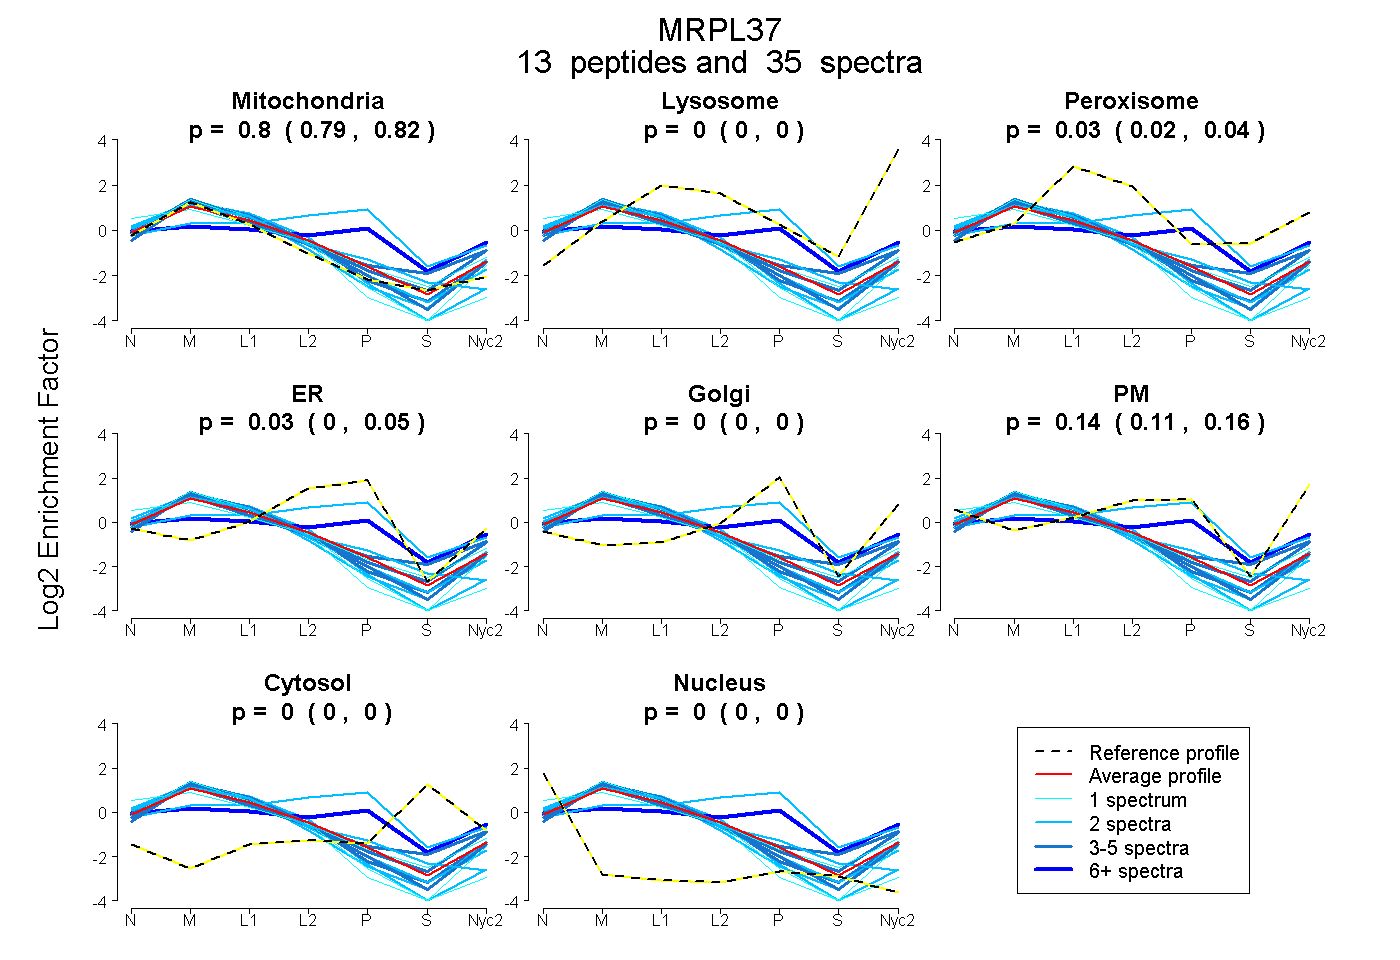
0.789 | 0.815
0.000 | 0.000
0.016 | 0.041
0.001 | 0.054
0.000 | 0.000
0.112 | 0.160
0.000 | 0.000
0.000 | 0.000
4peptides
spectra
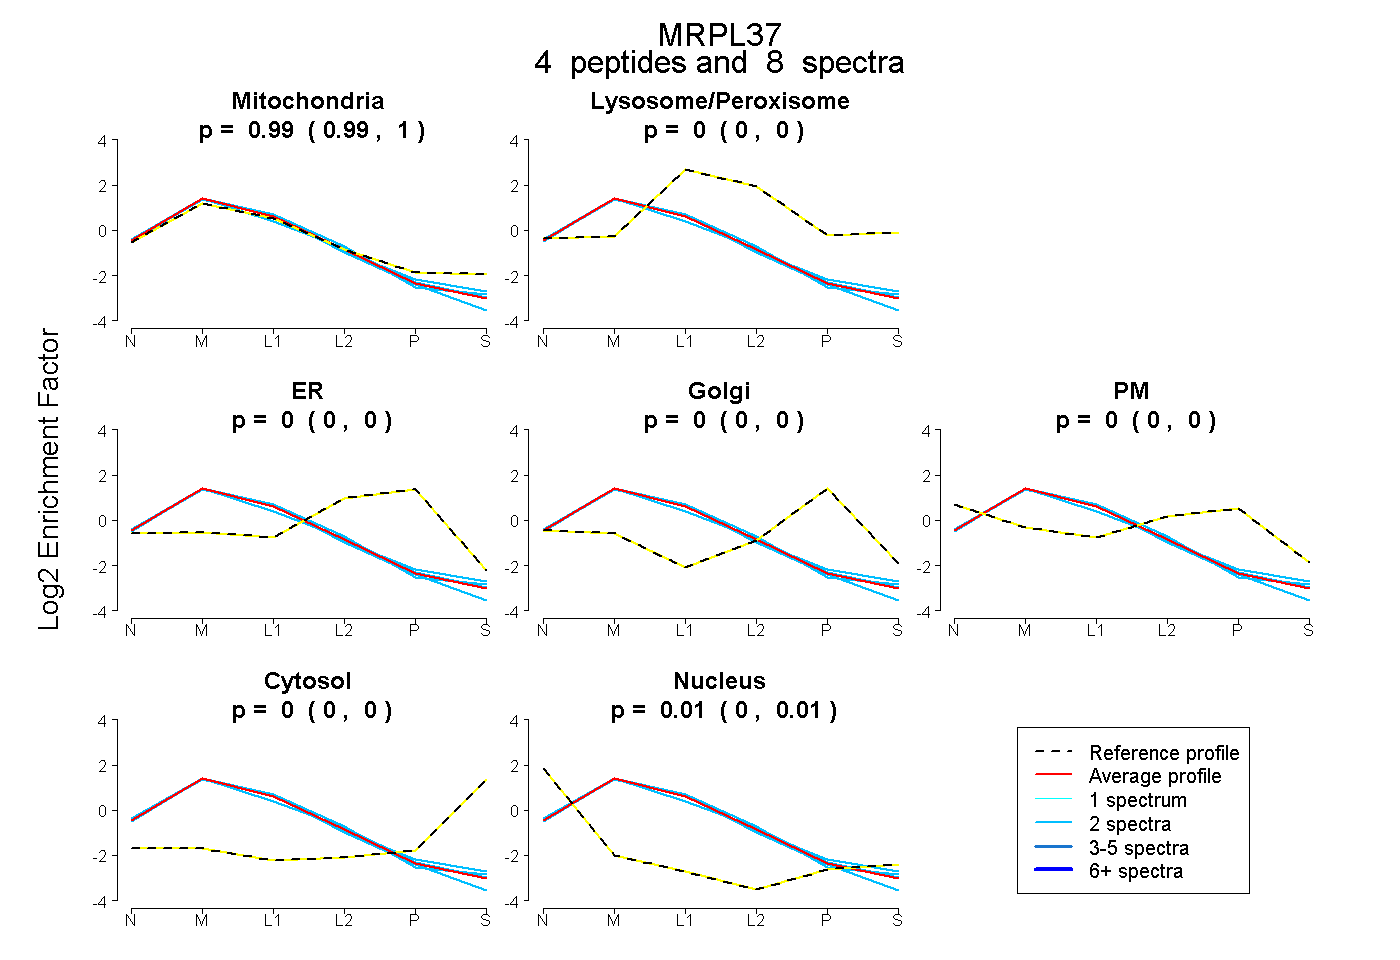
0.987 | 0.998
0.000 | 0.000
0.000 | 0.000
0.000 | 0.000
0.000 | 0.000
0.000 | 0.000
0.000 | 0.012
17peptides
spectra
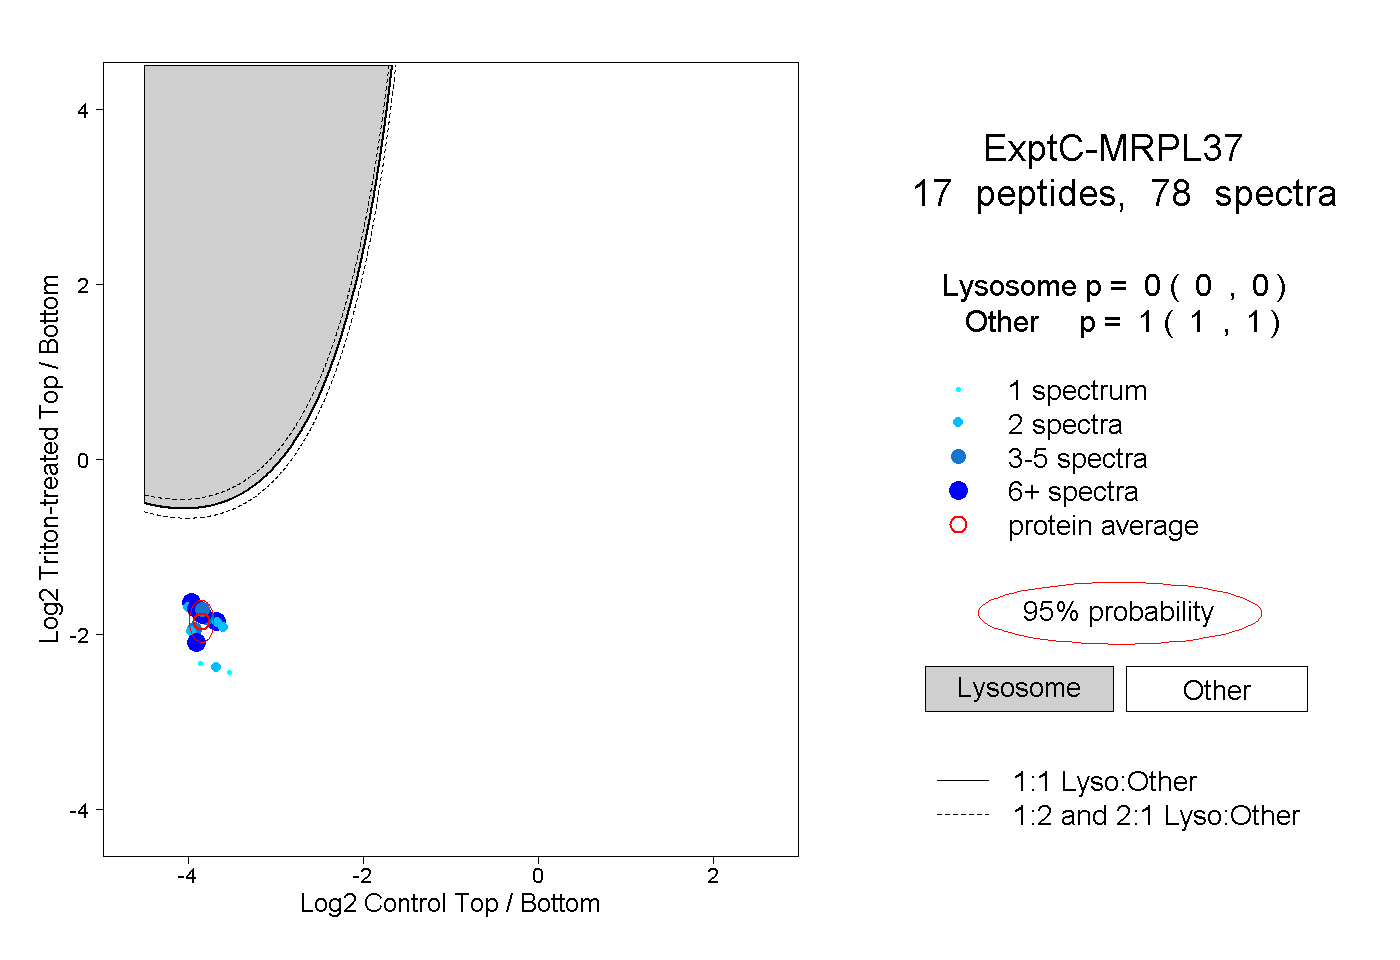
0.000 | 0.000
1.000 | 1.000
6peptides
spectra
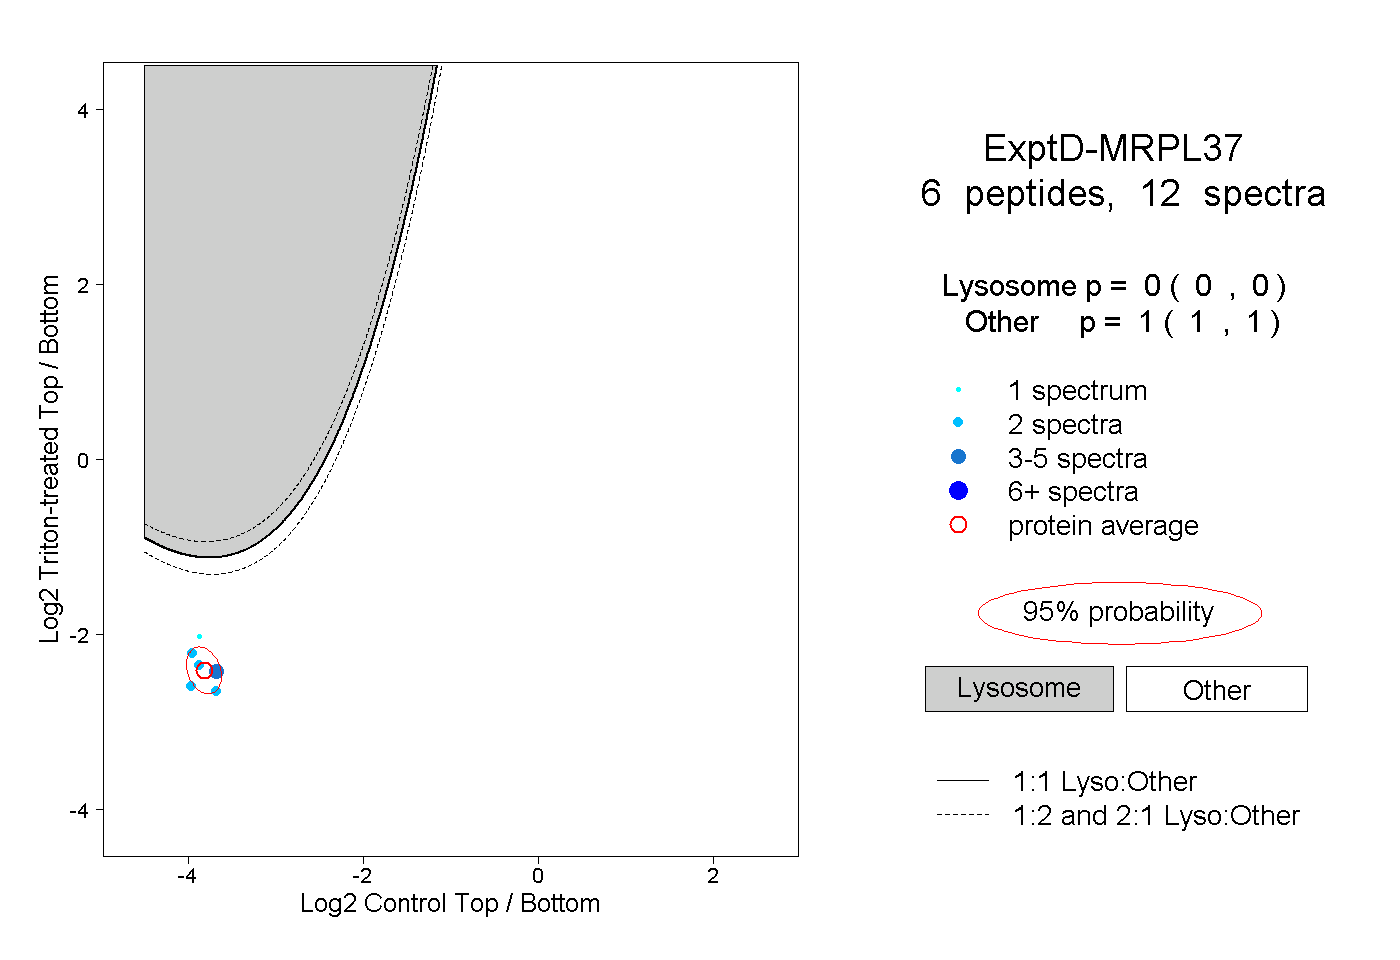
0.000 | 0.000
1.000 | 1.000