 13
13peptides
spectra
0.789 | 0.815
0.000 | 0.000
0.016 | 0.041
0.001 | 0.054
0.000 | 0.000
0.112 | 0.160
0.000 | 0.000
0.000 | 0.000
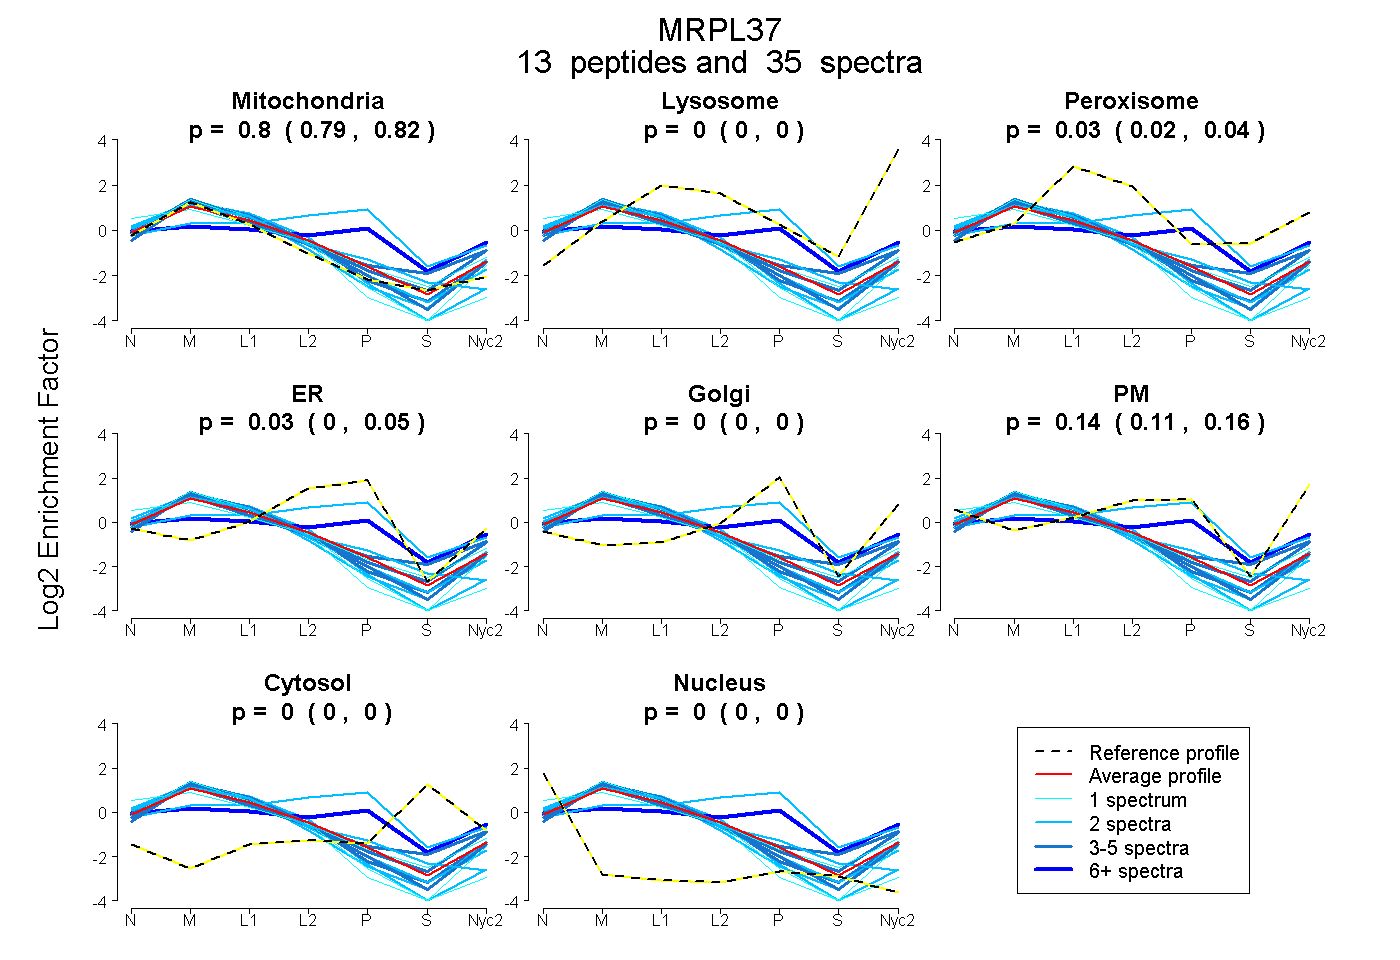
| Plot | Mito | Lyso | Perox | ER | Golgi | PM | Cytosol | Nucleus | |||||
| Expt A |
13 peptides |
35 spectra |
|
0.802 0.789 | 0.815 |
0.000 0.000 | 0.000 |
0.029 0.016 | 0.041 |
0.029 0.001 | 0.054 |
0.000 0.000 | 0.000 |
0.139 0.112 | 0.160 |
0.000 0.000 | 0.000 |
0.000 0.000 | 0.000 |
| 4 spectra, LLYGNTAR | 0.818 | 0.141 | 0.000 | 0.000 | 0.000 | 0.041 | 0.000 | 0.000 | ||
| 2 spectra, ETYCPLIVDNLLQLCK | 0.226 | 0.000 | 0.162 | 0.468 | 0.103 | 0.000 | 0.040 | 0.000 | ||
| 2 spectra, AAPIHEQPLYK | 0.998 | 0.000 | 0.000 | 0.002 | 0.000 | 0.000 | 0.000 | 0.000 | ||
| 2 spectra, VYEIPGLEPITYEGK | 0.874 | 0.000 | 0.000 | 0.126 | 0.000 | 0.000 | 0.000 | 0.000 | ||
| 2 spectra, ESLLLQVR | 0.941 | 0.059 | 0.000 | 0.000 | 0.000 | 0.000 | 0.000 | 0.000 | ||
| 4 spectra, DPLPPIASR | 0.895 | 0.052 | 0.011 | 0.000 | 0.000 | 0.041 | 0.000 | 0.000 | ||
| 7 spectra, ANLRPQR | 0.391 | 0.000 | 0.110 | 0.061 | 0.330 | 0.052 | 0.056 | 0.000 | ||
| 1 spectrum, TSAQNCSLATTWNR | 1.000 | 0.000 | 0.000 | 0.000 | 0.000 | 0.000 | 0.000 | 0.000 | ||
| 1 spectrum, VLEQPIVVQSVGTDGR | 0.960 | 0.000 | 0.000 | 0.000 | 0.000 | 0.040 | 0.000 | 0.000 | ||
| 1 spectrum, VLSLVDDPTNHIENQEQR | 0.718 | 0.000 | 0.038 | 0.000 | 0.000 | 0.199 | 0.000 | 0.044 | ||
| 4 spectra, VLDIISHSR | 0.891 | 0.011 | 0.000 | 0.000 | 0.000 | 0.099 | 0.000 | 0.000 | ||
| 2 spectra, EEVEATR | 0.921 | 0.000 | 0.014 | 0.000 | 0.000 | 0.065 | 0.000 | 0.000 | ||
| 3 spectra, FLPEQLR | 0.740 | 0.138 | 0.010 | 0.000 | 0.000 | 0.060 | 0.053 | 0.000 |
| Plot | Mito | Lyso or Perox | ER | Golgi | PM | Cytosol | Nucleus | ||||||
| Expt B |
4 peptides |
8 spectra |
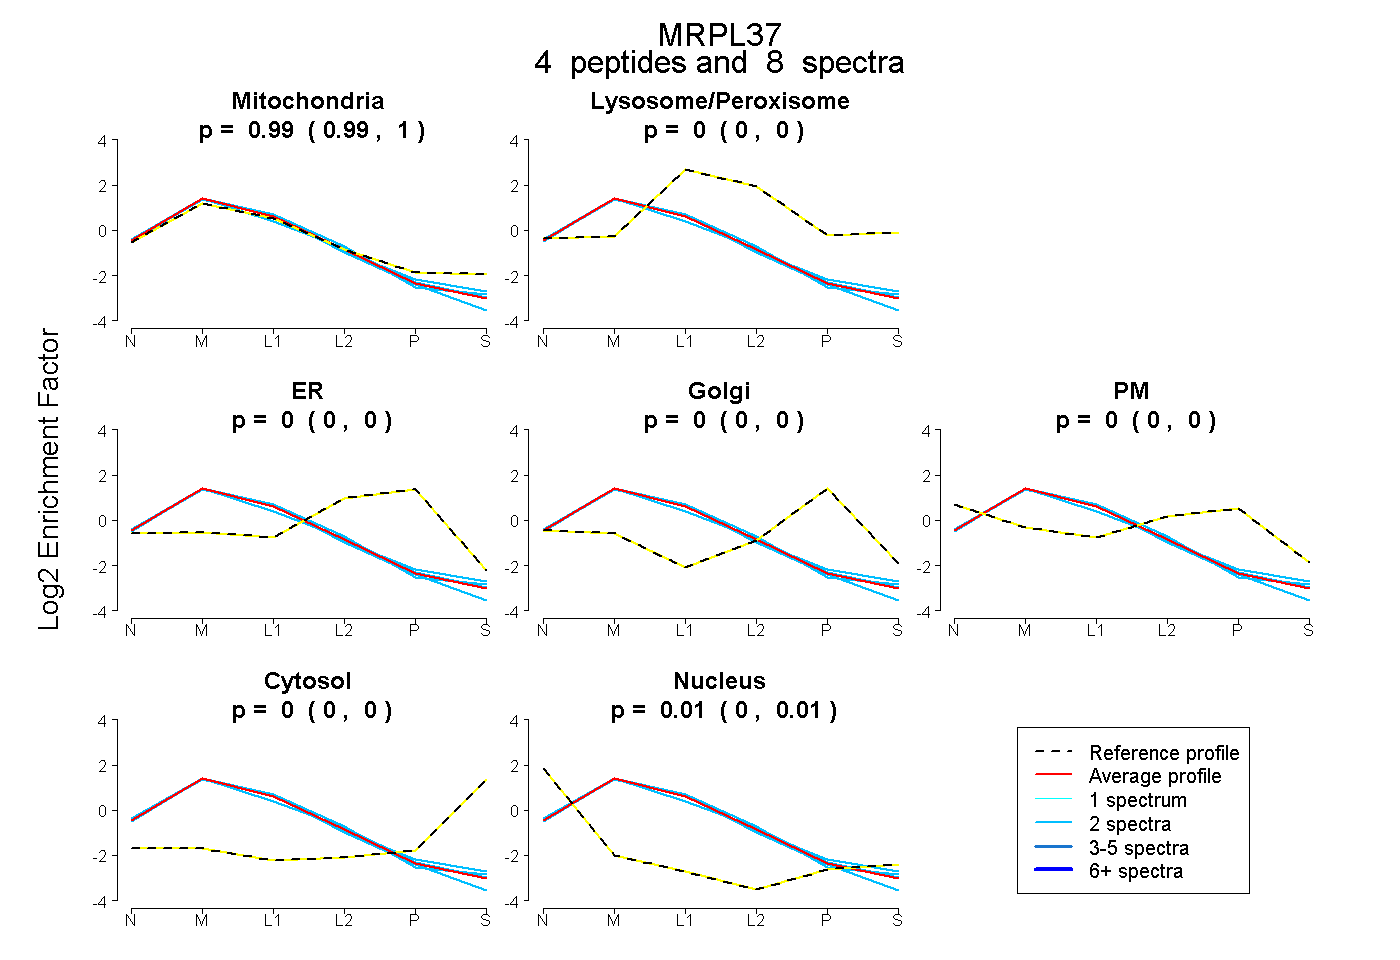 |
0.993 0.987 | 0.998 |
0.000 0.000 | 0.000 |
0.000 0.000 | 0.000 |
0.000 0.000 | 0.000 |
0.000 0.000 | 0.000 |
0.000 0.000 | 0.000 |
0.007 0.000 | 0.012 |
|||
| Plot | Lyso | Other | |||||||||||
| Expt C |
17 peptides |
78 spectra |
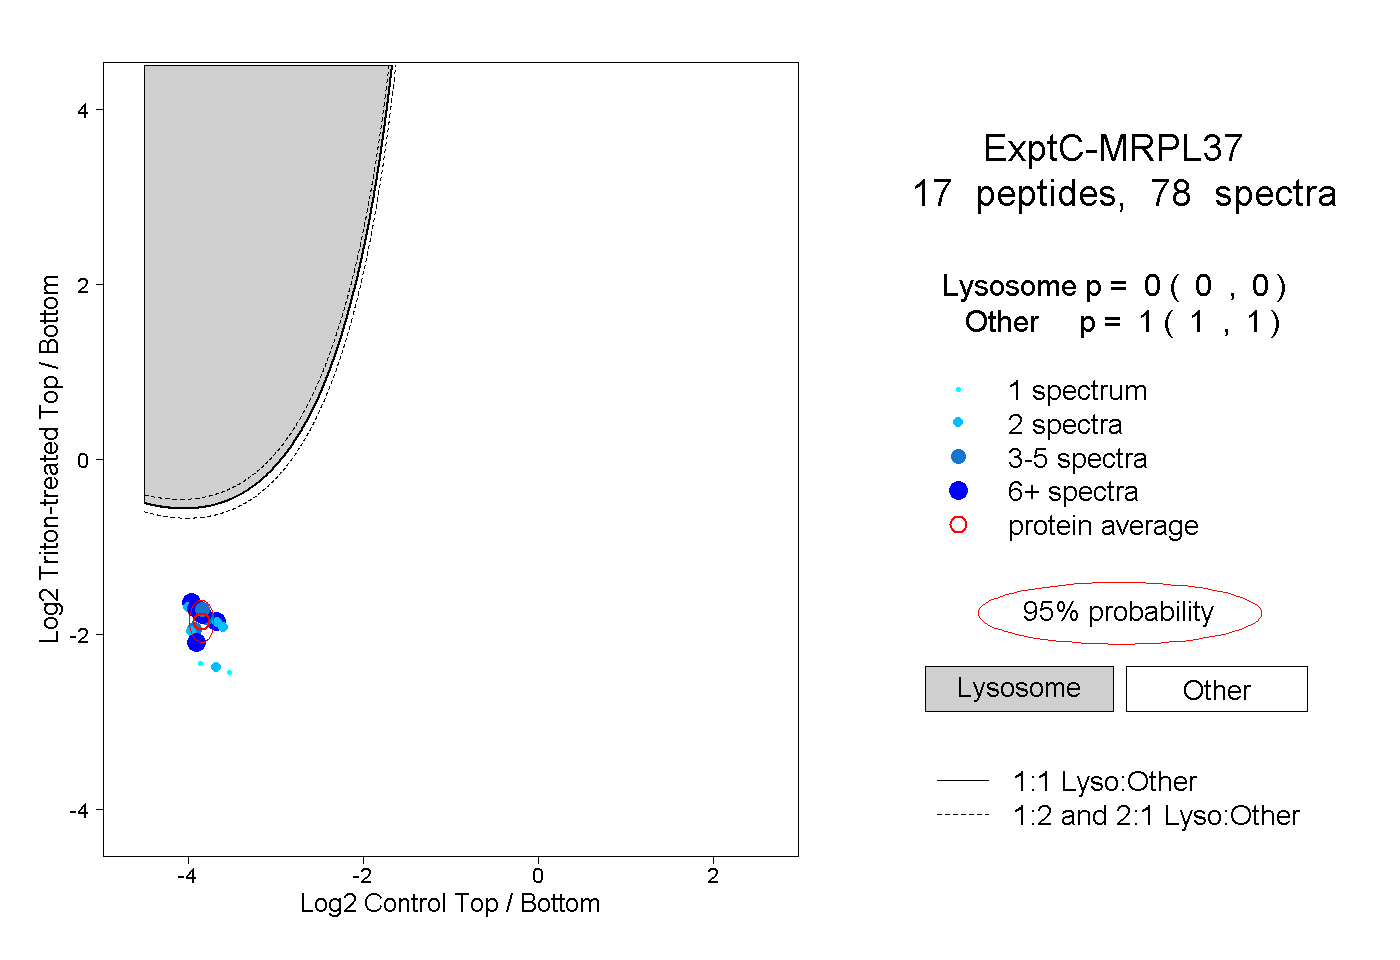 |
0.000 0.000 | 0.000 |
1.000 1.000 | 1.000 |
||||||||
| Plot | Lyso | Other | |||||||||||
| Expt D |
6 peptides |
12 spectra |
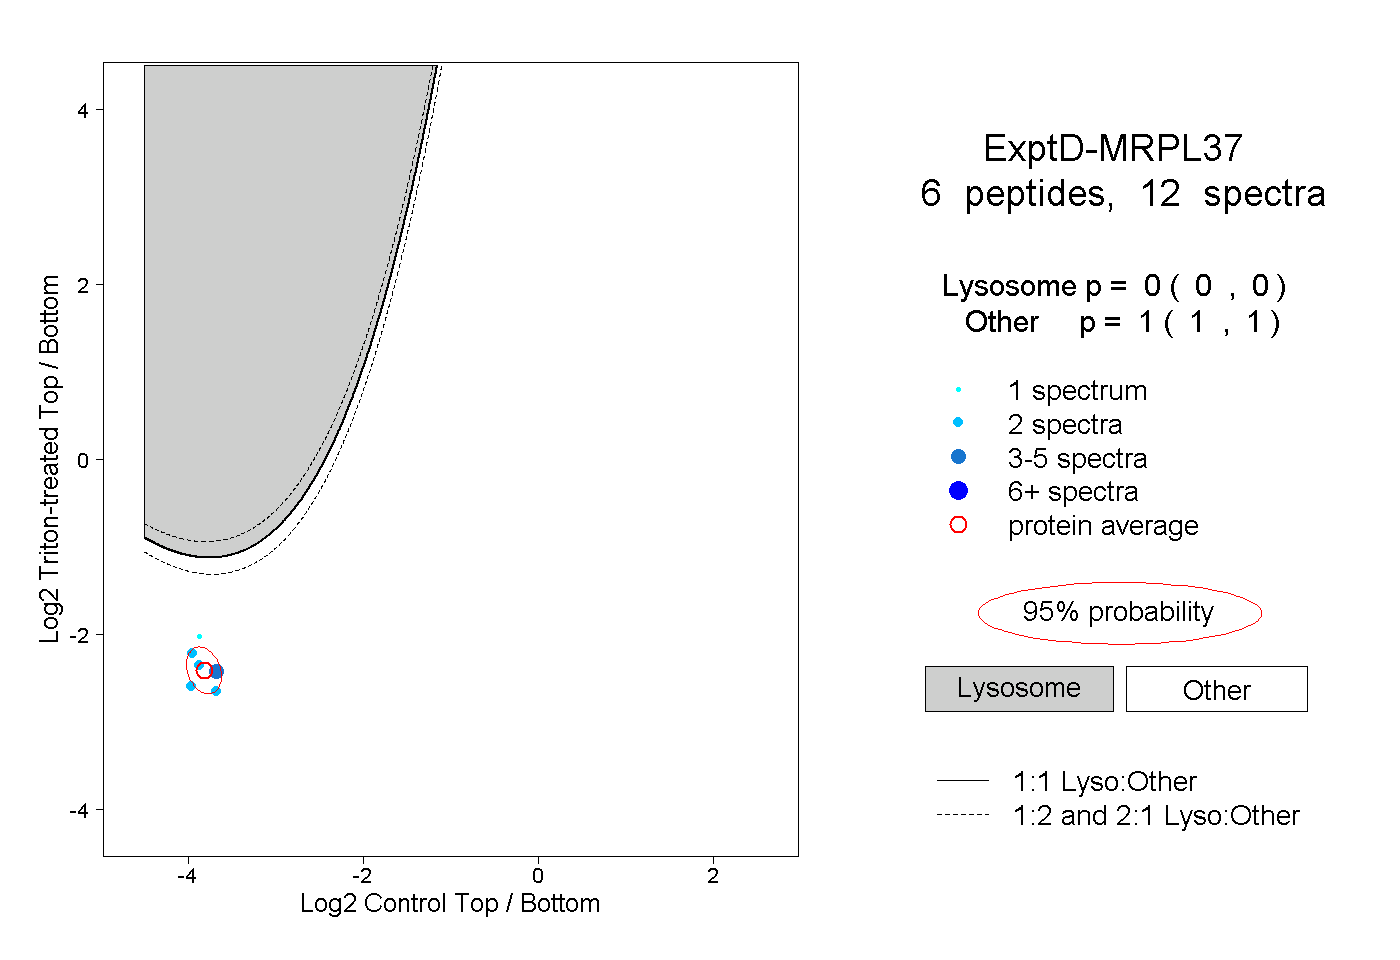 |
0.000 0.000 | 0.000 |
1.000 1.000 | 1.000 |