 4
4peptides
spectra
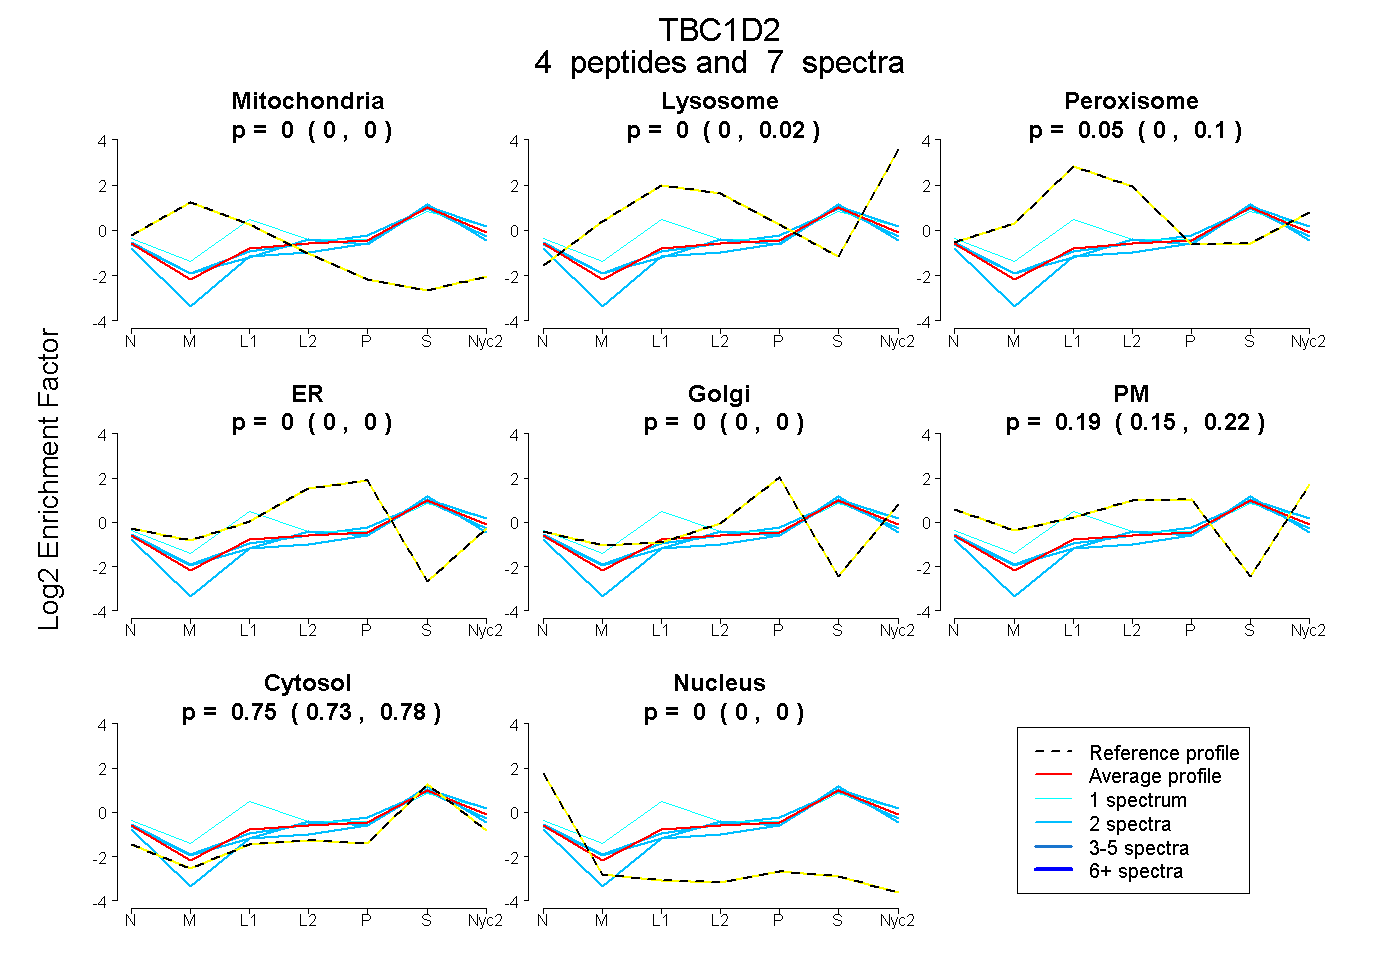
0.000 | 0.000
0.000 | 0.022
0.000 | 0.101
0.000 | 0.000
0.000 | 0.000
0.154 | 0.216
0.725 | 0.779
0.000 | 0.000
2peptides
spectra
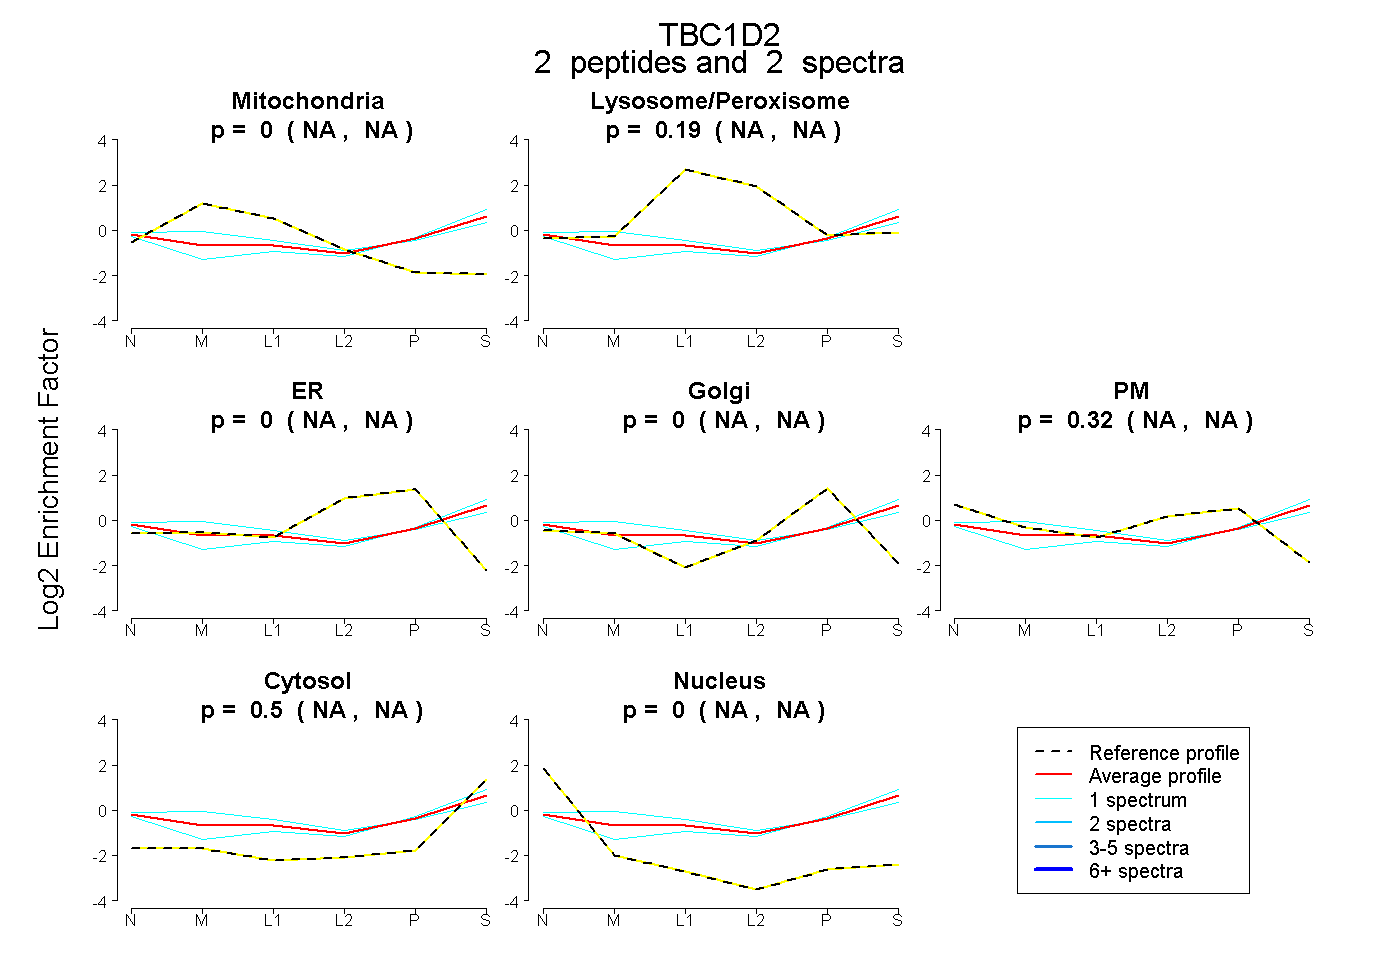
NA | NA
NA | NA
NA | NA
NA | NA
NA | NA
NA | NA
NA | NA
4peptides
spectra
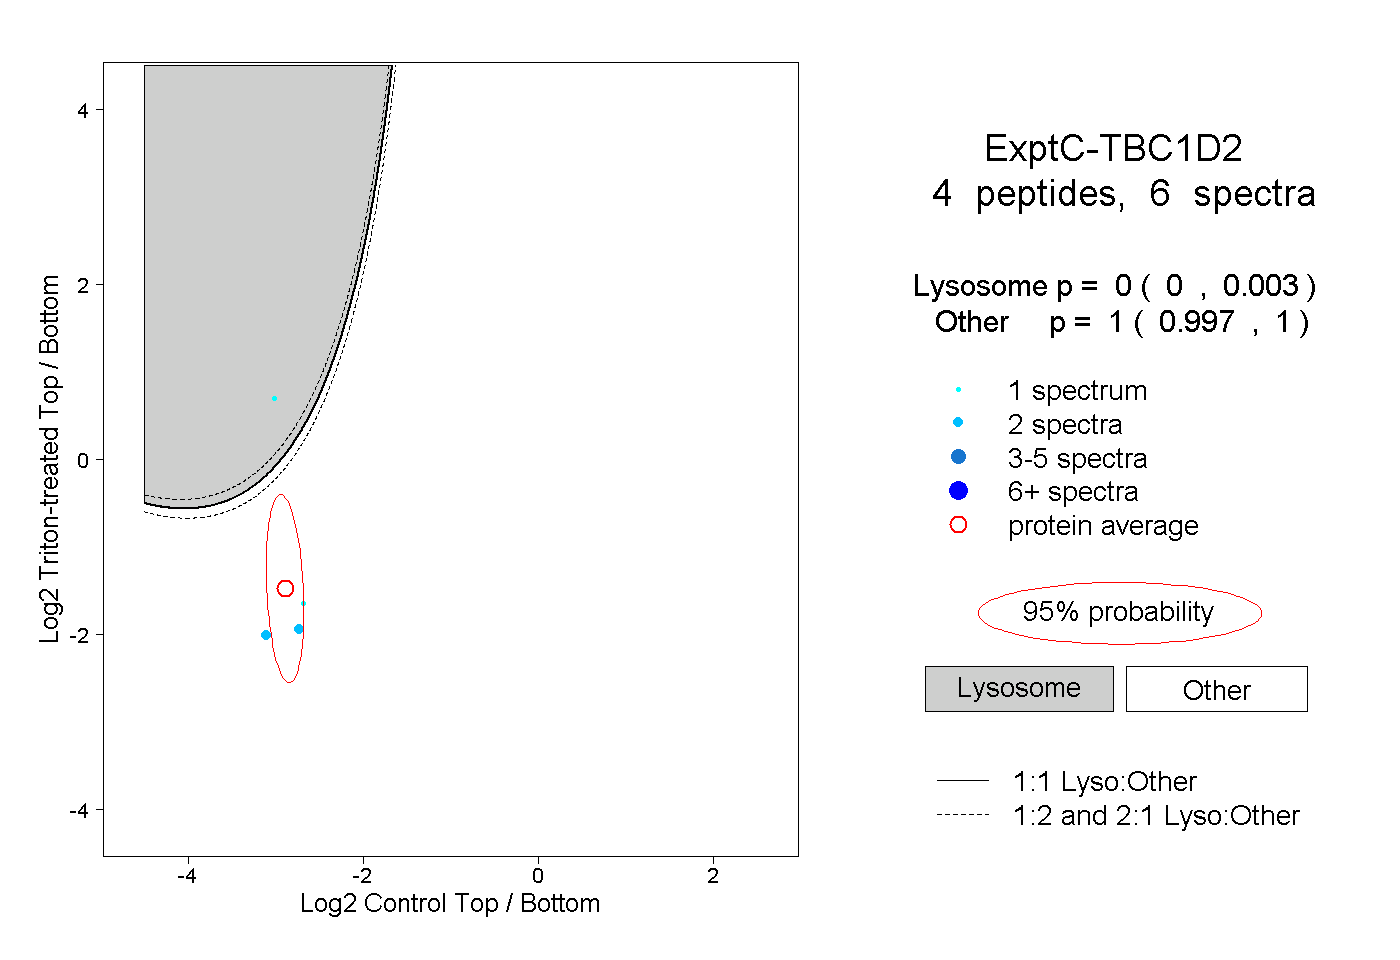
0.000 | 0.003
0.997 | 1.000