 4
4peptides
spectra
0.000 | 0.000
0.000 | 0.022
0.000 | 0.101
0.000 | 0.000
0.000 | 0.000
0.154 | 0.216
0.725 | 0.779
0.000 | 0.000
2peptides
spectra
NA | NA
NA | NA
NA | NA
NA | NA
NA | NA
NA | NA
NA | NA
| Plot | Mito | Lyso | Perox | ER | Golgi | PM | Cytosol | Nucleus | |||||
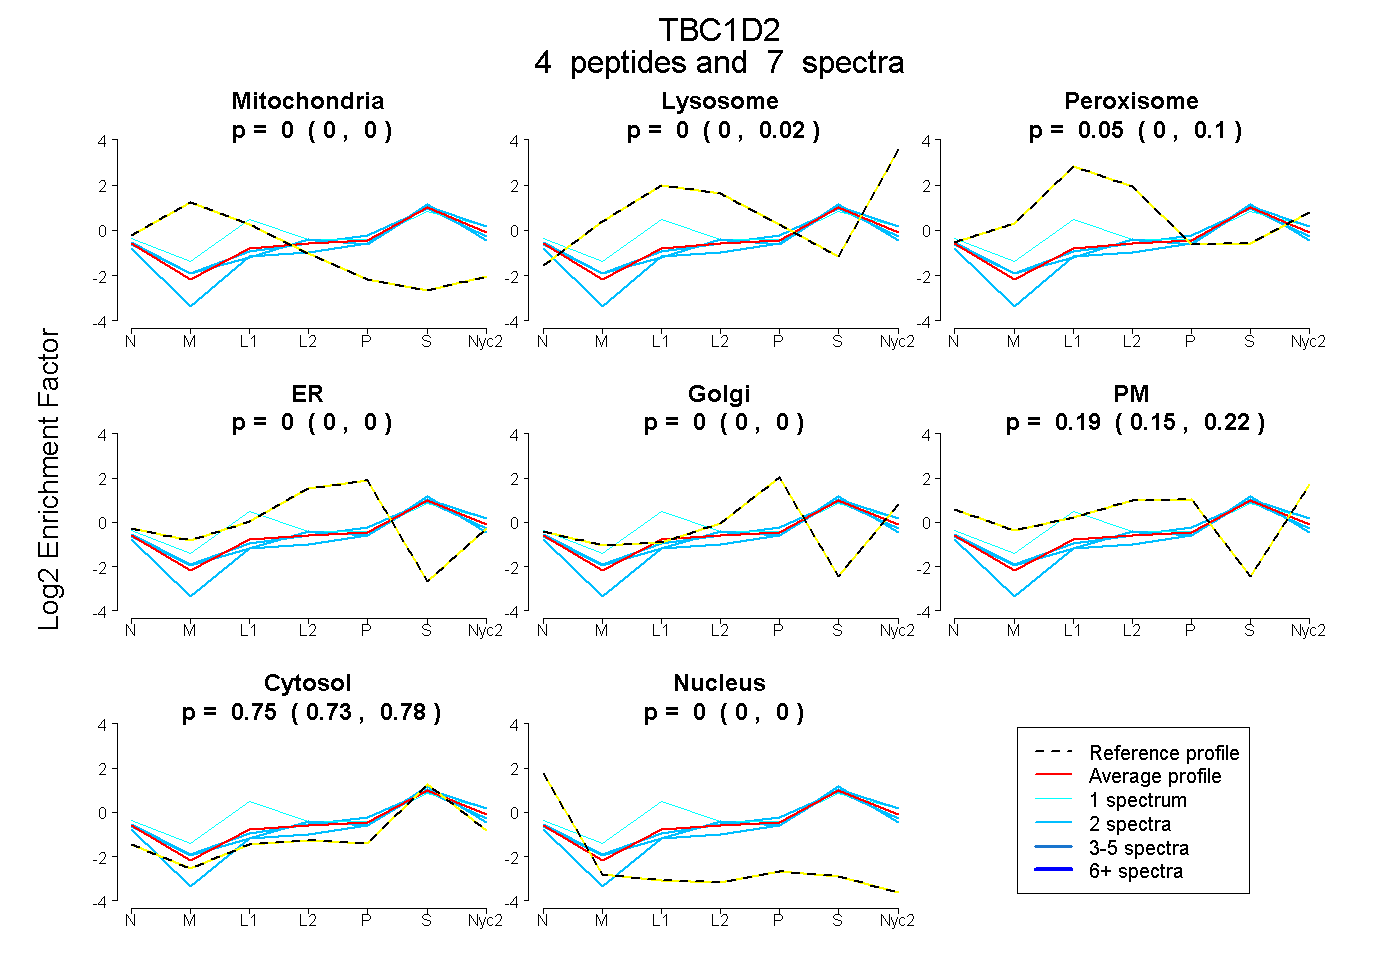
| Expt A |
4 peptides |
7 spectra |
|
0.000 0.000 | 0.000 |
0.000 0.000 | 0.022 |
0.054 0.000 | 0.101 |
0.000 0.000 | 0.000 |
0.000 0.000 | 0.000 |
0.192 0.154 | 0.216 |
0.754 0.725 | 0.779 |
0.000 0.000 | 0.000 |
||
| Plot | Mito | Lyso or Perox | ER | Golgi | PM | Cytosol | Nucleus | ||||||
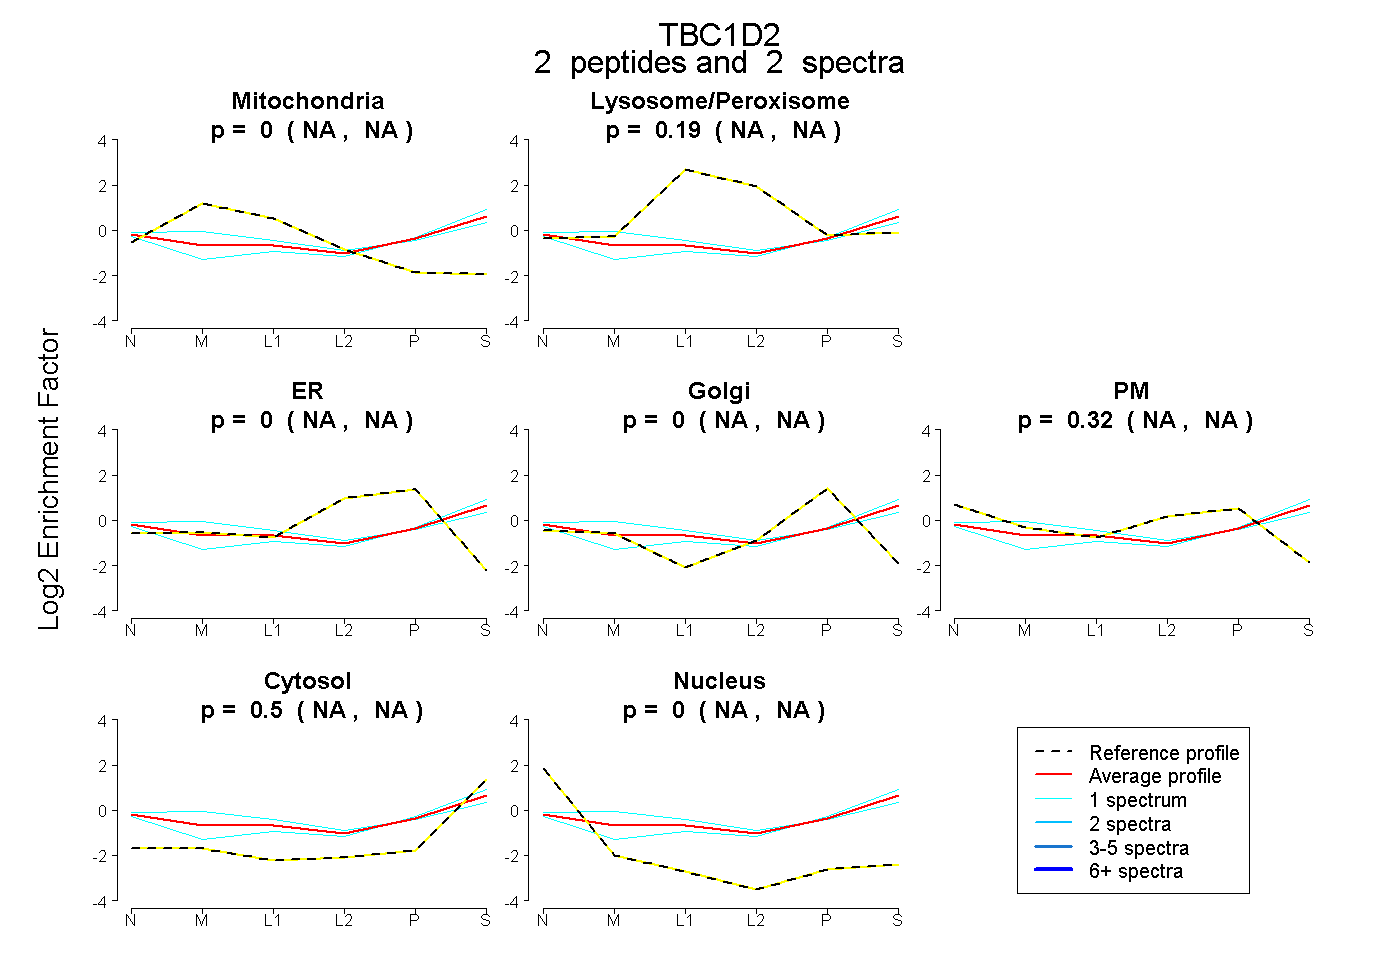
| Expt B |
2 peptides |
2 spectra |
|
0.000 NA | NA |
0.189 NA | NA |
0.000 NA | NA |
0.000 NA | NA |
0.316 NA | NA |
0.495 NA | NA |
0.000 NA | NA |
| 1 spectrum, VEALEQDR | 0.000 | 0.164 | 0.000 | 0.023 | 0.238 | 0.575 | 0.000 | |||
| 1 spectrum, LVHEAGLR | 0.113 | 0.190 | 0.000 | 0.000 | 0.309 | 0.388 | 0.000 |
| Plot | Lyso | Other | |||||||||||
| Expt C |
4 peptides |
6 spectra |
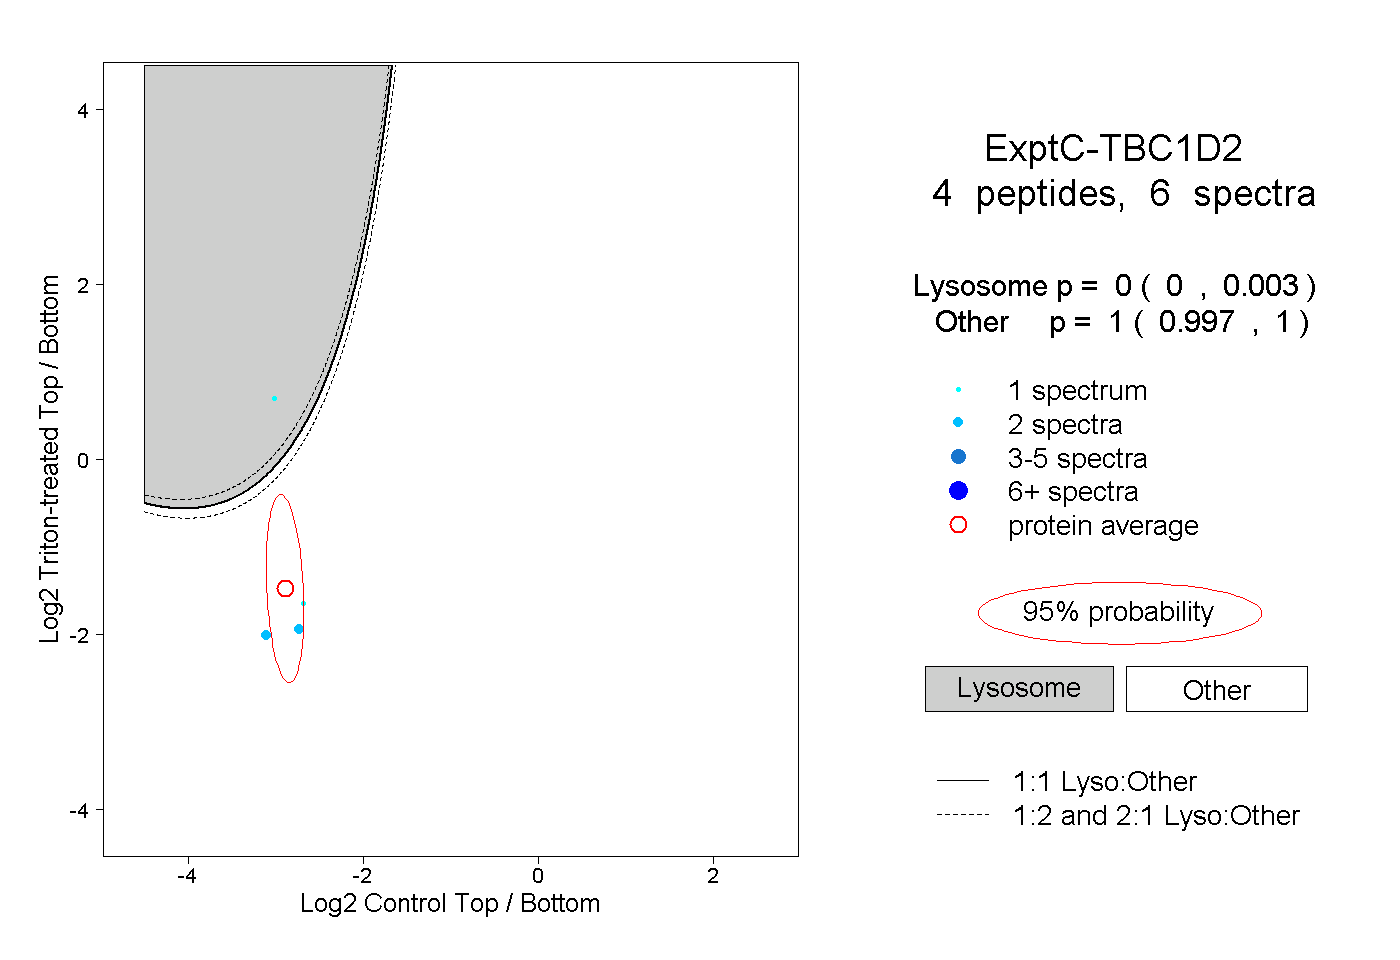 |
0.000 0.000 | 0.003 |
1.000 0.997 | 1.000 |