 9
9peptides
spectra
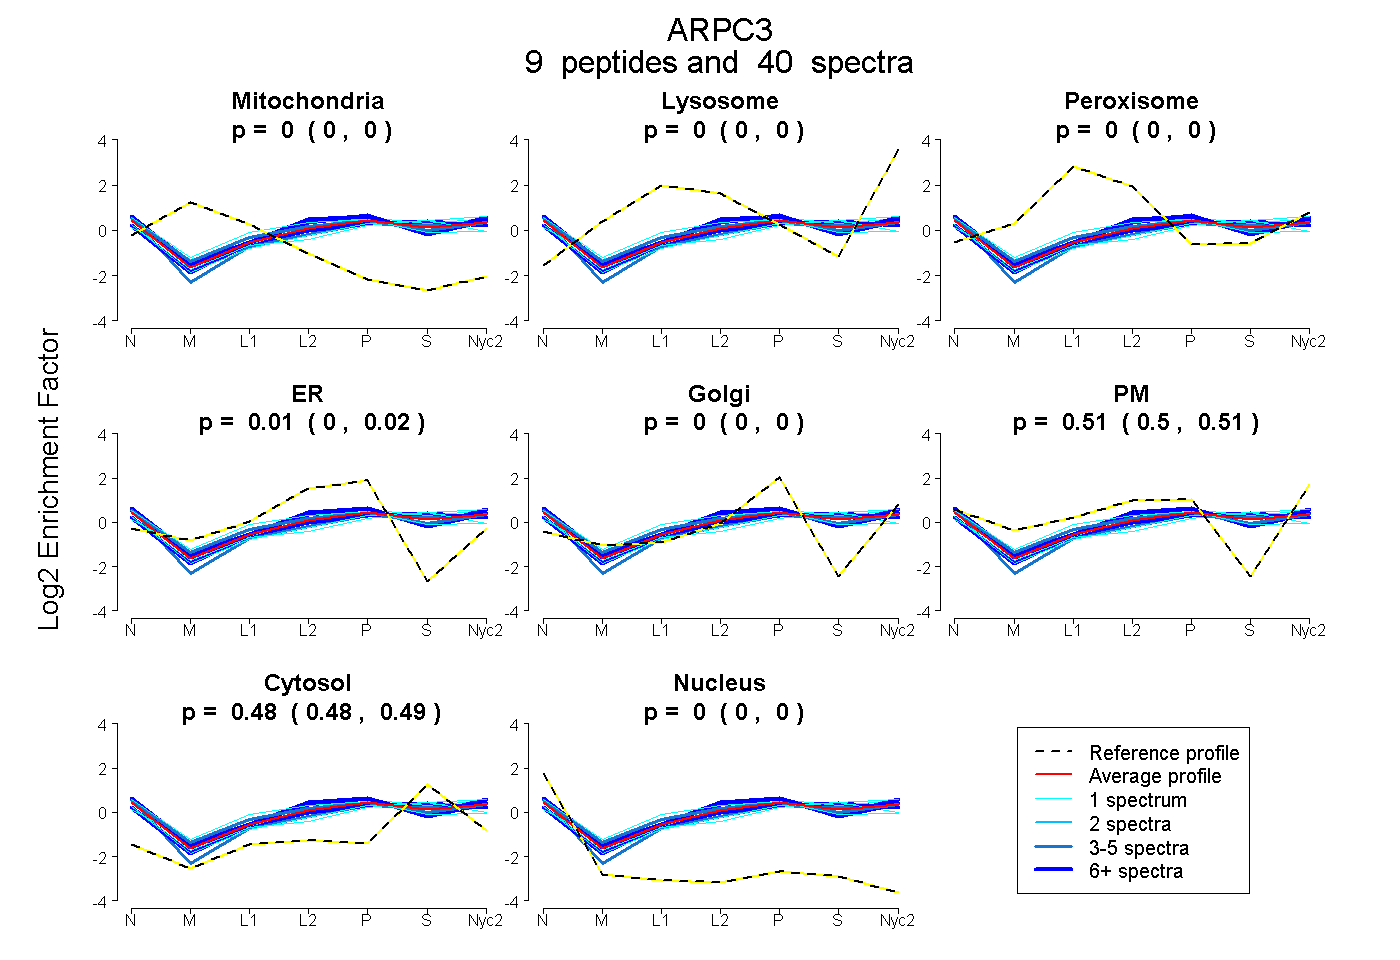
0.000 | 0.000
0.000 | 0.000
0.000 | 0.000
0.000 | 0.017
0.000 | 0.000
0.498 | 0.514
0.481 | 0.488
0.000 | 0.000
3peptides
spectra
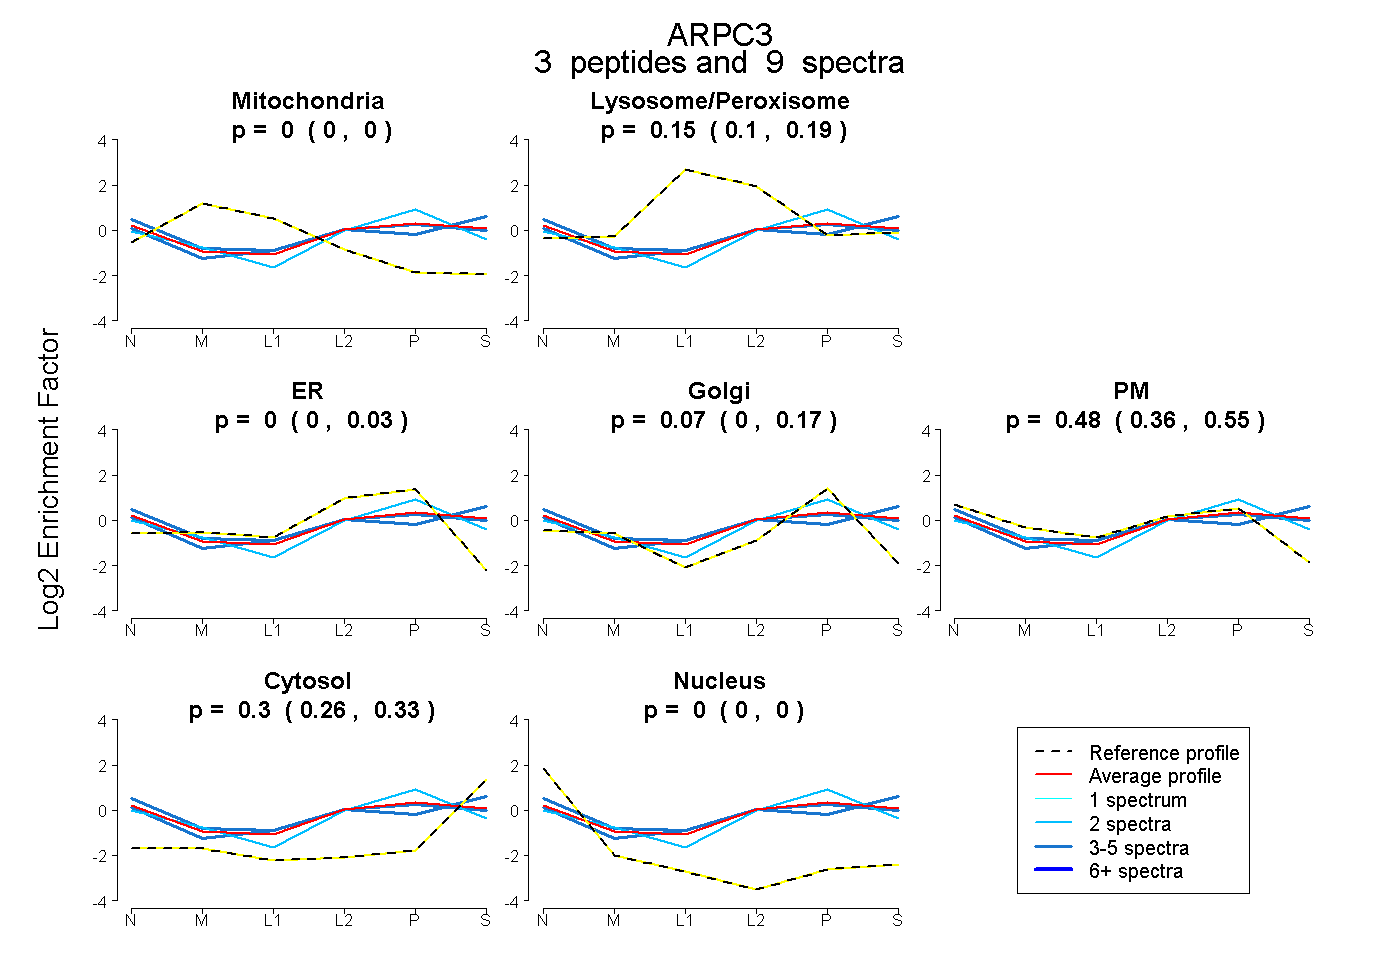
0.000 | 0.000
0.102 | 0.192
0.000 | 0.034
0.000 | 0.165
0.362 | 0.555
0.259 | 0.331
0.000 | 0.000
8peptides
spectra
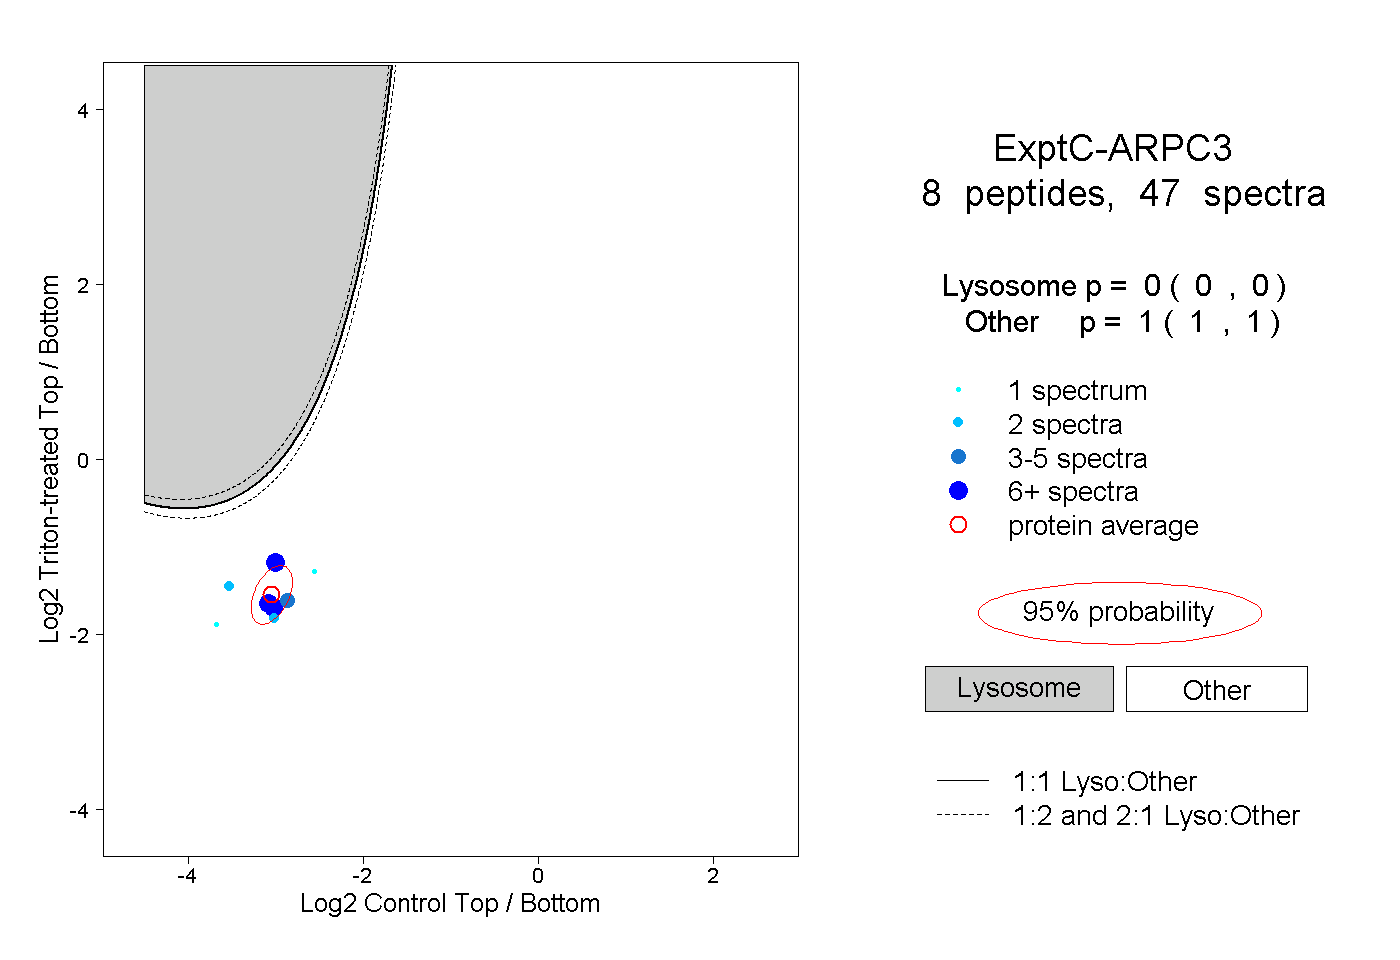
0.000 | 0.000
1.000 | 1.000
2peptides
spectra
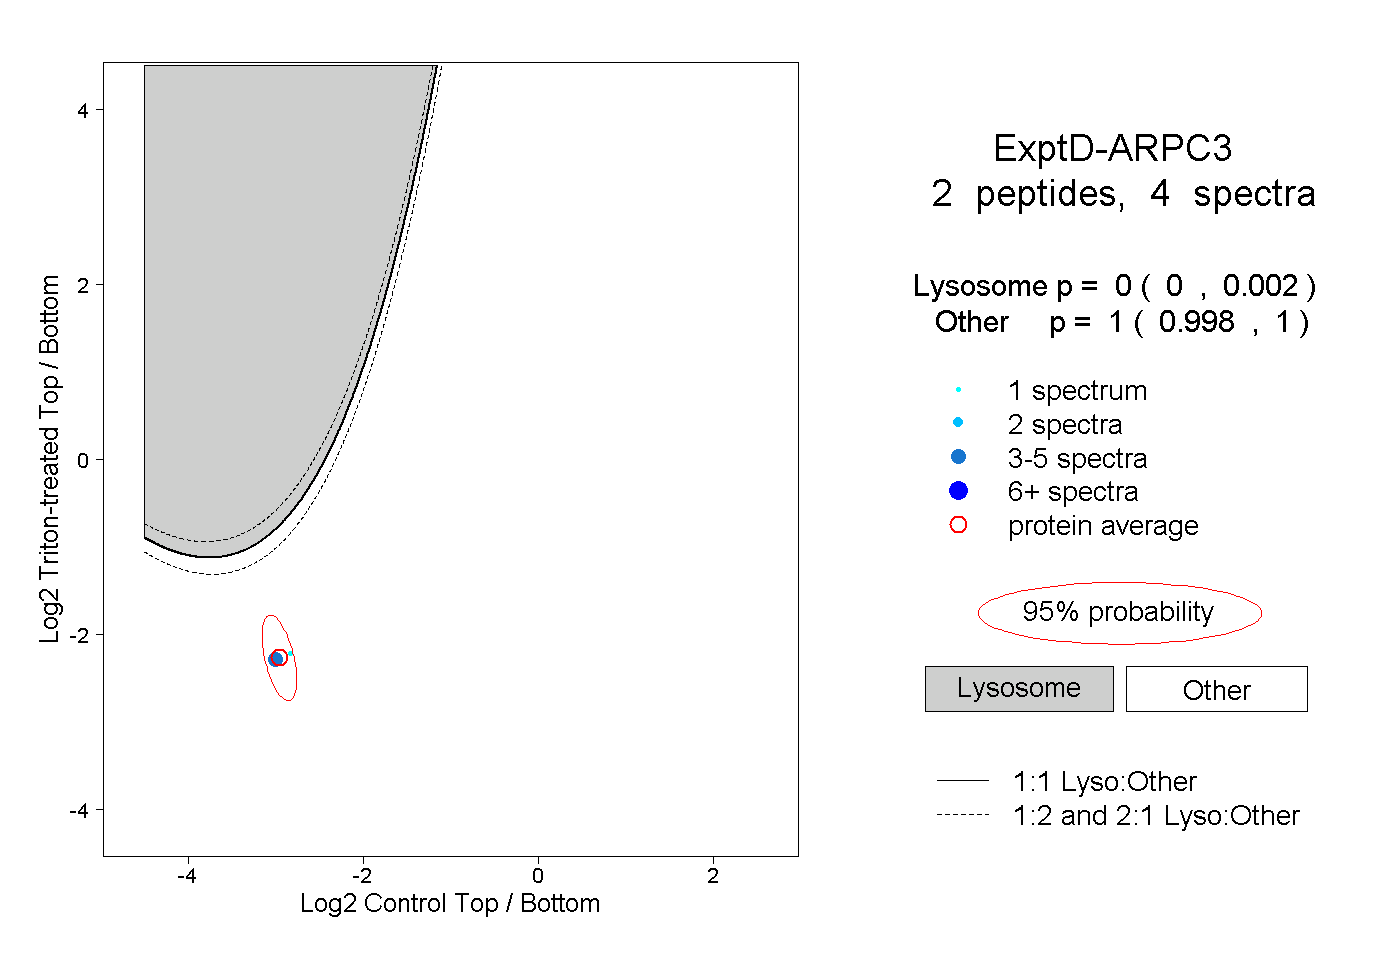
0.000 | 0.002
0.998 | 1.000