 9
9peptides
spectra
0.000 | 0.000
0.000 | 0.000
0.000 | 0.000
0.000 | 0.017
0.000 | 0.000
0.498 | 0.514
0.481 | 0.488
0.000 | 0.000
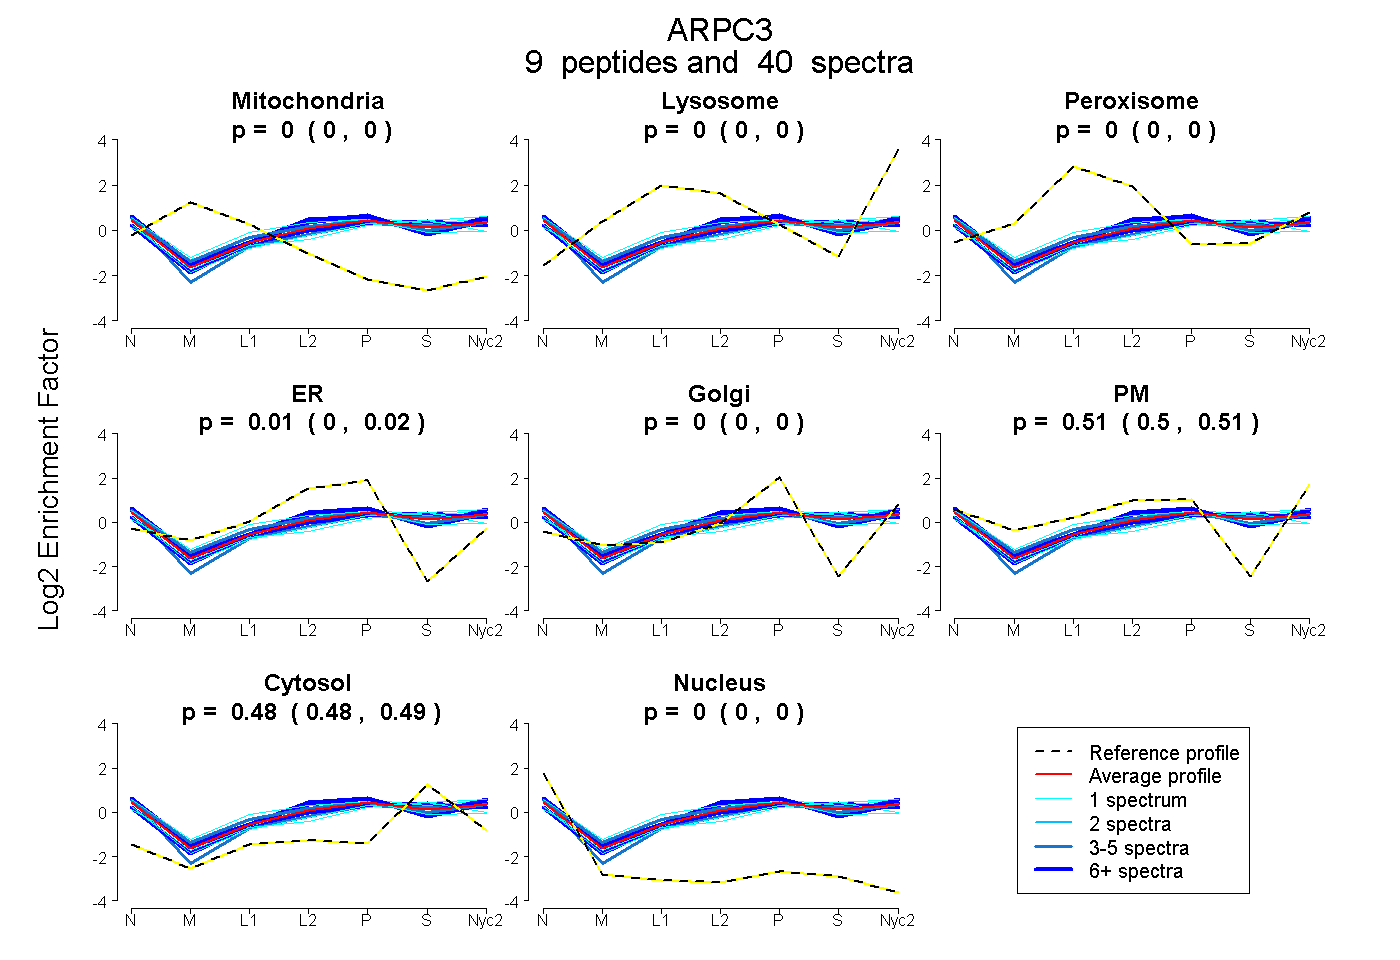
| Plot | Mito | Lyso | Perox | ER | Golgi | PM | Cytosol | Nucleus | |||||
| Expt A |
9 peptides |
40 spectra |
|
0.000 0.000 | 0.000 |
0.000 0.000 | 0.000 |
0.000 0.000 | 0.000 |
0.009 0.000 | 0.017 |
0.000 0.000 | 0.000 |
0.507 0.498 | 0.514 |
0.484 0.481 | 0.488 |
0.000 0.000 | 0.000 |
| 1 spectrum, DTDIVDEAIYYFK | 0.000 | 0.000 | 0.016 | 0.000 | 0.000 | 0.508 | 0.476 | 0.000 | ||
| 3 spectra, ANVFFK | 0.000 | 0.000 | 0.000 | 0.000 | 0.000 | 0.453 | 0.545 | 0.002 | ||
| 6 spectra, QETGLR | 0.000 | 0.000 | 0.000 | 0.060 | 0.000 | 0.533 | 0.406 | 0.000 | ||
| 1 spectrum, WWTCFVK | 0.000 | 0.000 | 0.125 | 0.157 | 0.000 | 0.324 | 0.377 | 0.016 | ||
| 15 spectra, LIGNMALLPIR | 0.000 | 0.000 | 0.000 | 0.028 | 0.000 | 0.562 | 0.410 | 0.000 | ||
| 1 spectrum, VFDPQNDKPSK | 0.000 | 0.000 | 0.000 | 0.000 | 0.000 | 0.449 | 0.551 | 0.000 | ||
| 8 spectra, AYLQQLR | 0.000 | 0.000 | 0.005 | 0.023 | 0.000 | 0.421 | 0.550 | 0.000 | ||
| 4 spectra, SLSGPGQ | 0.000 | 0.000 | 0.047 | 0.009 | 0.000 | 0.513 | 0.430 | 0.000 | ||
| 1 spectrum, PAYHSSLMDPDTK | 0.000 | 0.000 | 0.000 | 0.001 | 0.000 | 0.404 | 0.595 | 0.000 |
| Plot | Mito | Lyso or Perox | ER | Golgi | PM | Cytosol | Nucleus | ||||||
| Expt B |
3 peptides |
9 spectra |
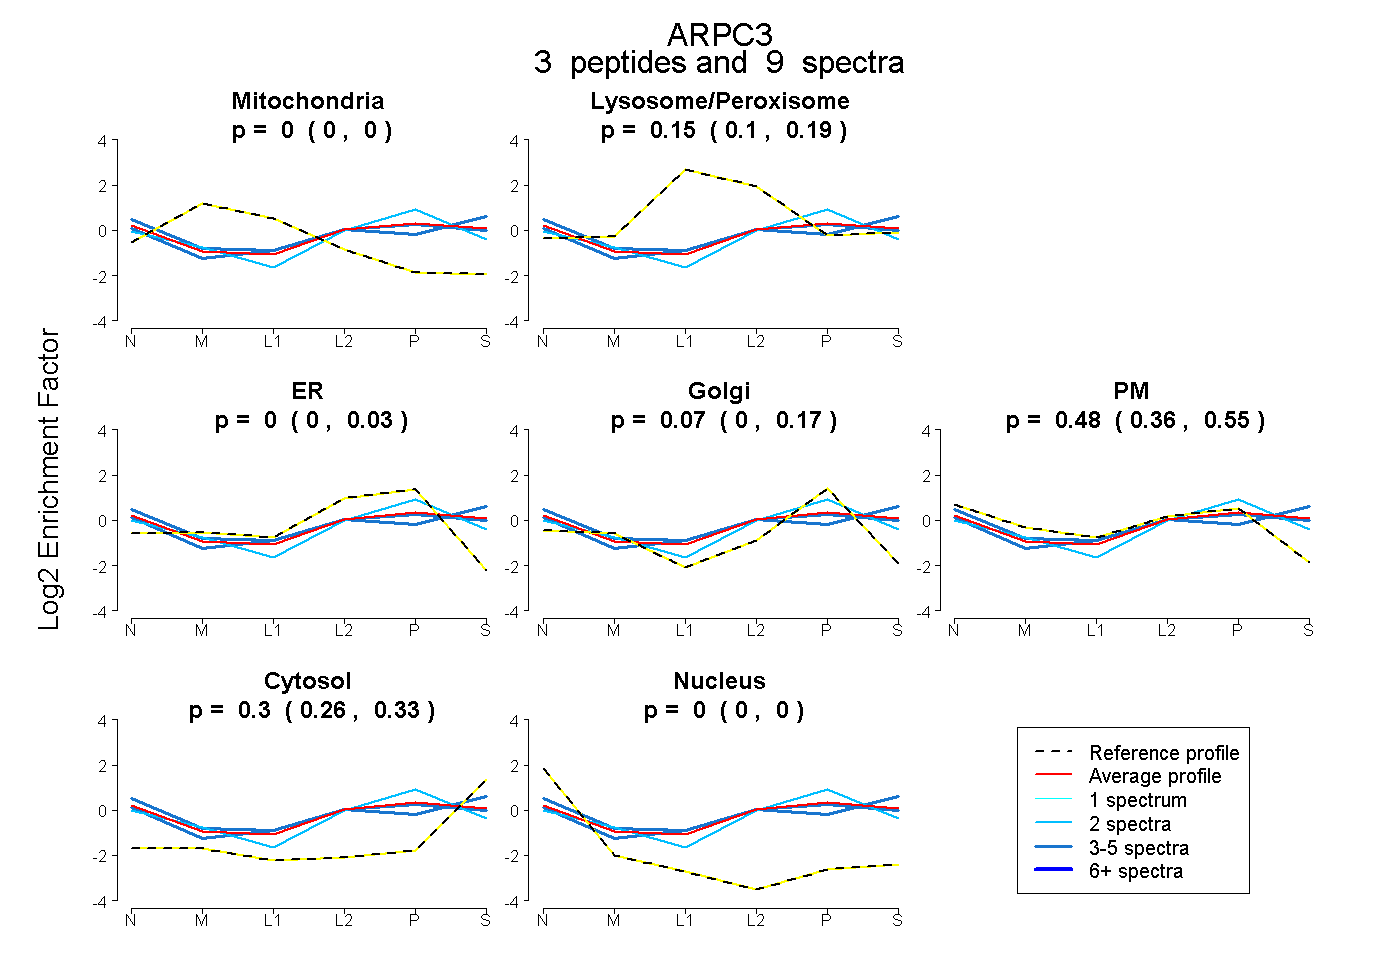 |
0.000 0.000 | 0.000 |
0.152 0.102 | 0.192 |
0.000 0.000 | 0.034 |
0.071 0.000 | 0.165 |
0.479 0.362 | 0.555 |
0.298 0.259 | 0.331 |
0.000 0.000 | 0.000 |
|||
| Plot | Lyso | Other | |||||||||||
| Expt C |
8 peptides |
47 spectra |
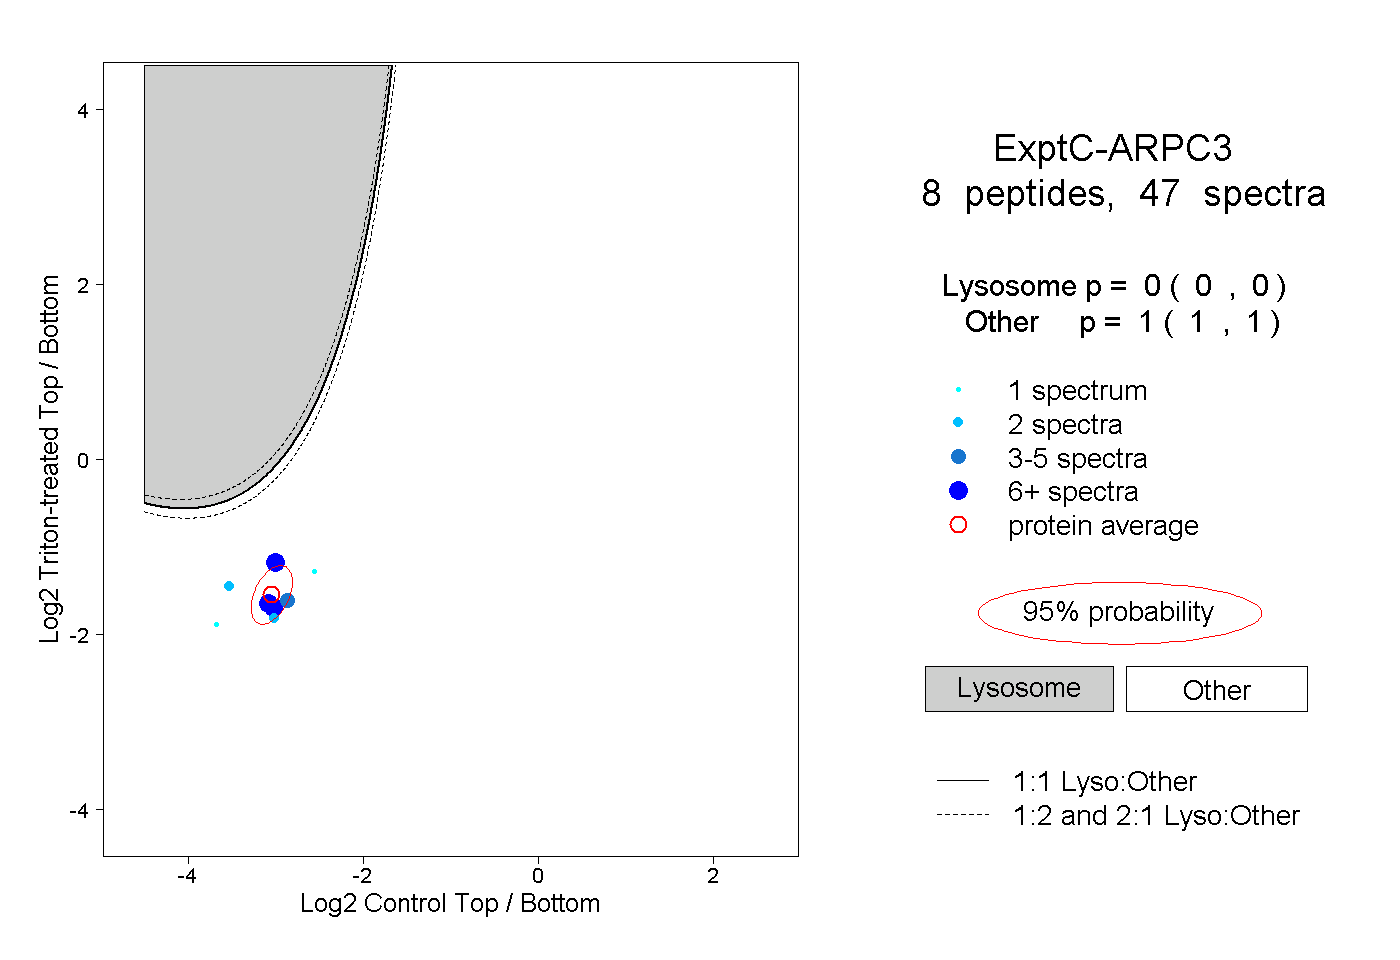 |
0.000 0.000 | 0.000 |
1.000 1.000 | 1.000 |
||||||||
| Plot | Lyso | Other | |||||||||||
| Expt D |
2 peptides |
4 spectra |
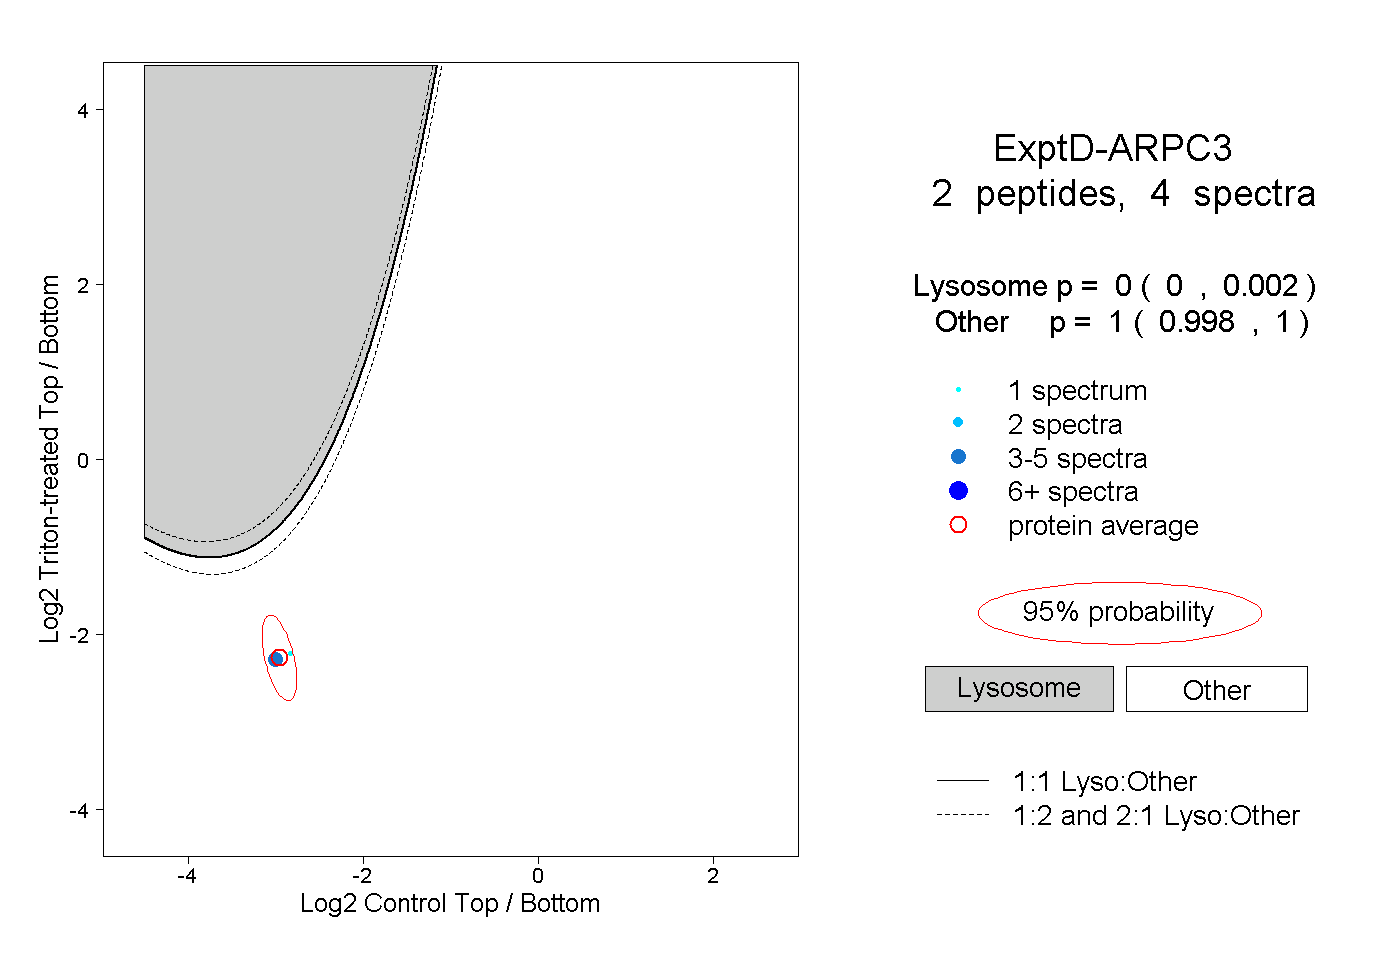 |
0.000 0.000 | 0.002 |
1.000 0.998 | 1.000 |