 4
4peptides
spectra
0.000 | 0.000
0.000 | 0.000
0.000 | 0.000
0.155 | 0.369
0.000 | 0.171
0.000 | 0.000
0.213 | 0.293
0.350 | 0.435
1peptide
spectrum
NA | NA
NA | NA
NA | NA
NA | NA
NA | NA
NA | NA
NA | NA
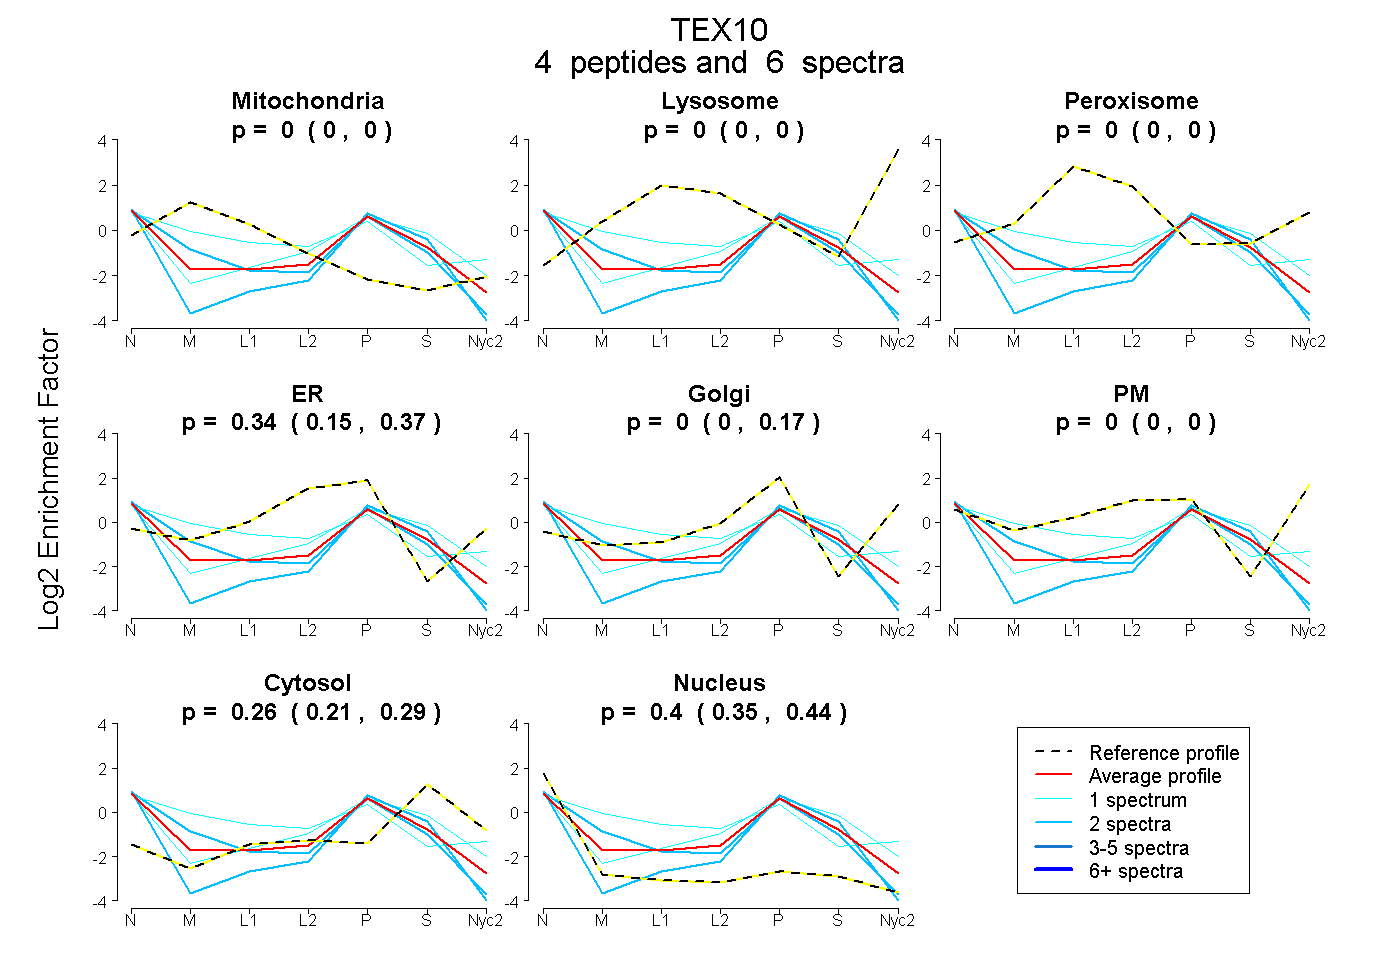
| Plot | Mito | Lyso | Perox | ER | Golgi | PM | Cytosol | Nucleus | |||||
| Expt A |
4 peptides |
6 spectra |
|
0.000 0.000 | 0.000 |
0.000 0.000 | 0.000 |
0.000 0.000 | 0.000 |
0.339 0.155 | 0.369 |
0.001 0.000 | 0.171 |
0.000 0.000 | 0.000 |
0.260 0.213 | 0.293 |
0.400 0.350 | 0.435 |
||
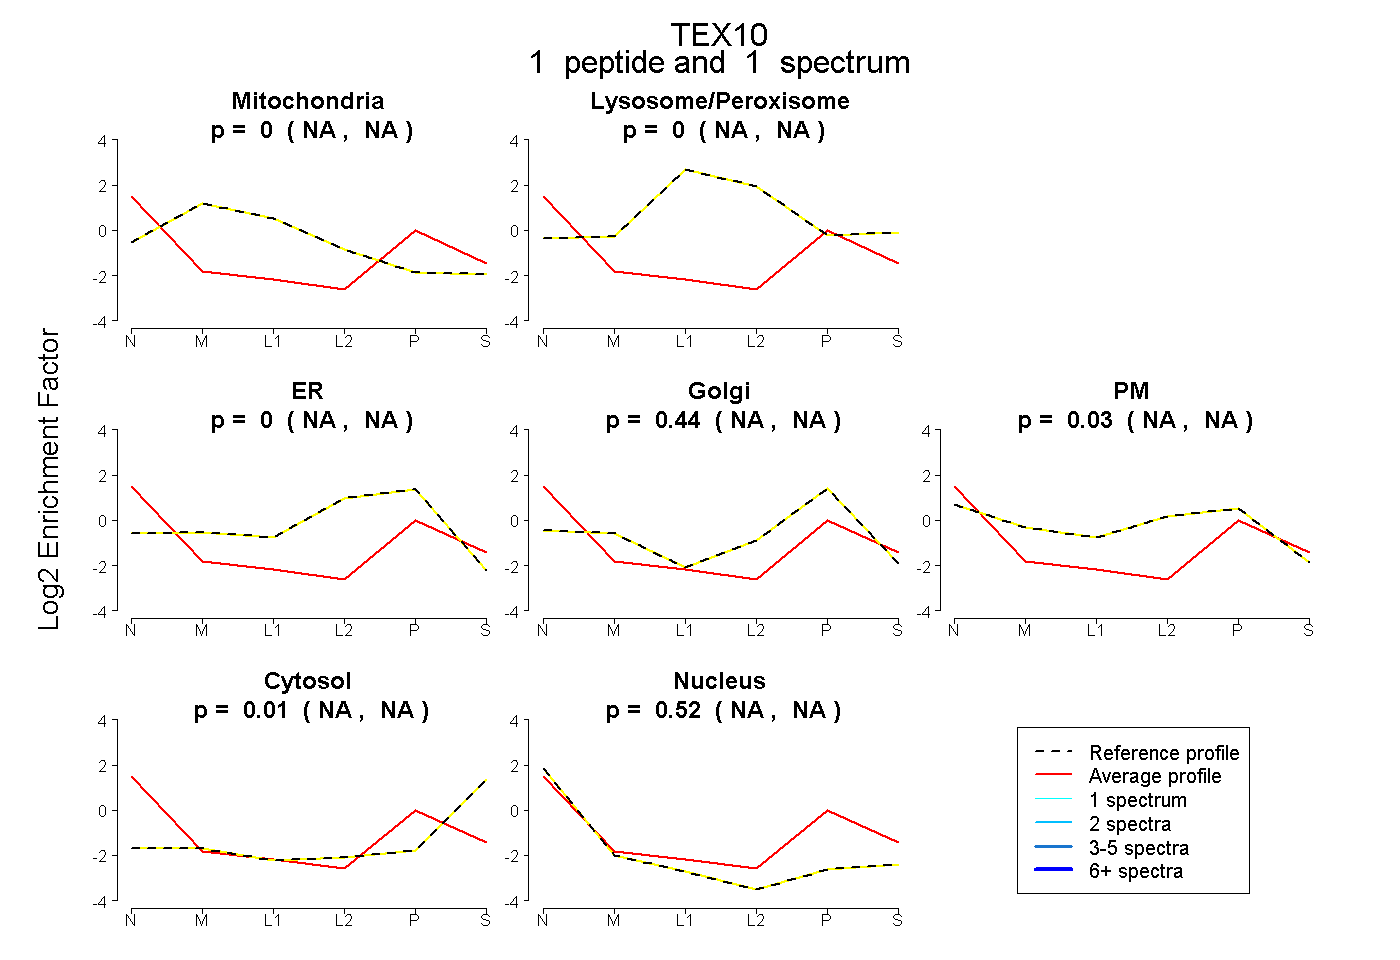
| Plot | Mito | Lyso or Perox | ER | Golgi | PM | Cytosol | Nucleus | ||||||
| Expt B |
1 peptide |
1 spectrum |
|
0.000 NA | NA |
0.000 NA | NA |
0.000 NA | NA |
0.444 NA | NA |
0.025 NA | NA |
0.008 NA | NA |
0.523 NA | NA |