 4
4peptides
spectra
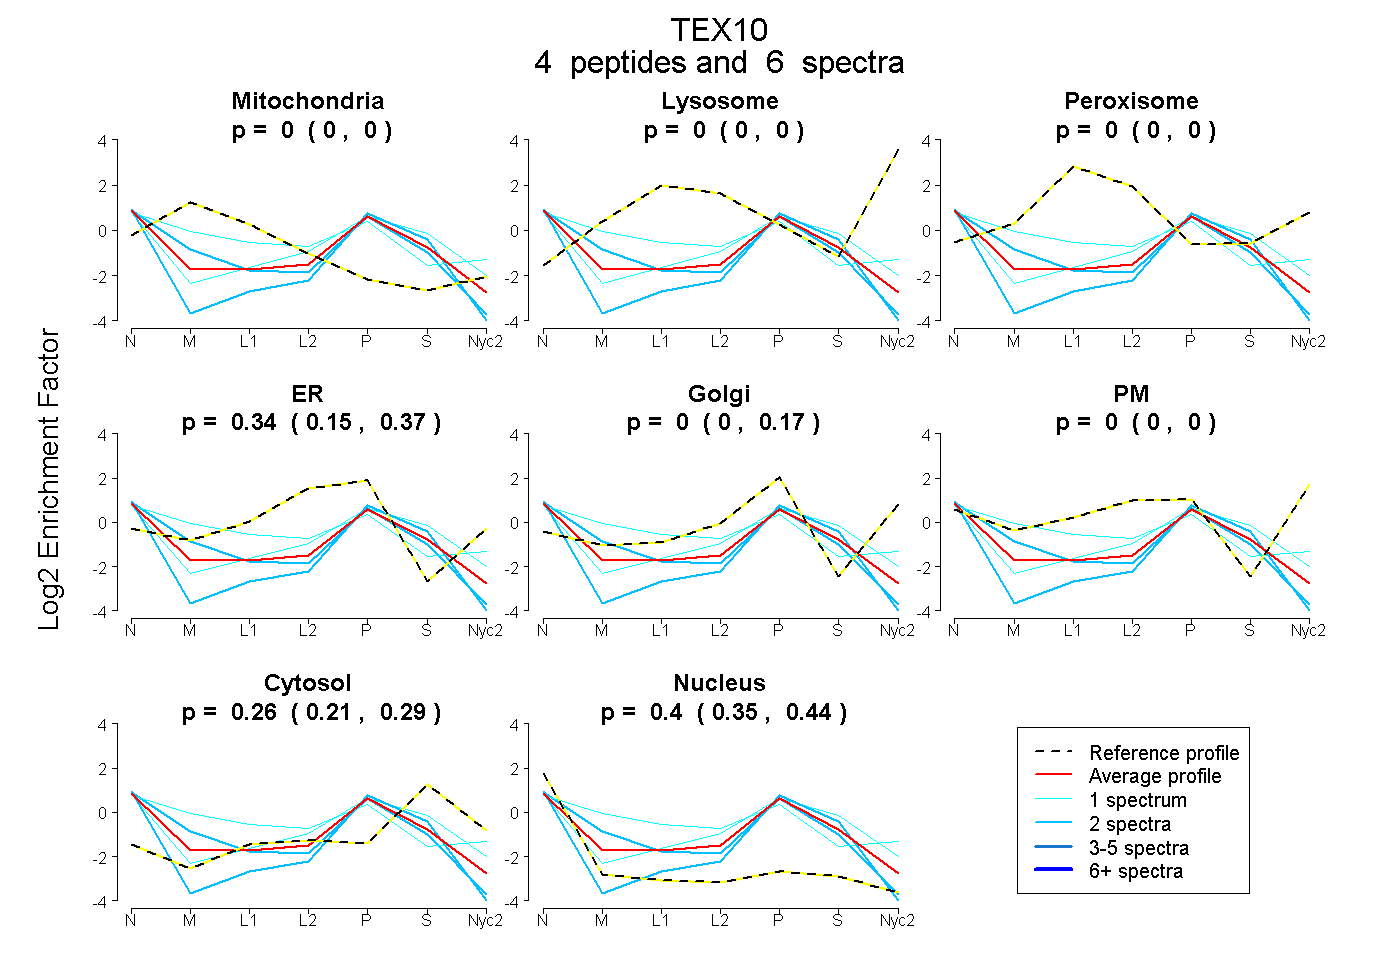
0.000 | 0.000
0.000 | 0.000
0.000 | 0.000
0.155 | 0.369
0.000 | 0.171
0.000 | 0.000
0.213 | 0.293
0.350 | 0.435
| Plot | Mito | Lyso | Perox | ER | Golgi | PM | Cytosol | Nucleus | |||||
| Expt A |
4 peptides |
6 spectra |
|
0.000 0.000 | 0.000 |
0.000 0.000 | 0.000 |
0.000 0.000 | 0.000 |
0.339 0.155 | 0.369 |
0.001 0.000 | 0.171 |
0.000 0.000 | 0.000 |
0.260 0.213 | 0.293 |
0.400 0.350 | 0.435 |
| 2 spectra, GLLLPVR | 0.064 | 0.000 | 0.000 | 0.317 | 0.000 | 0.000 | 0.151 | 0.467 | ||
| 1 spectrum, NLQAAALR | 0.277 | 0.000 | 0.075 | 0.153 | 0.295 | 0.000 | 0.039 | 0.160 | ||
| 2 spectra, LLLQHVPLR | 0.000 | 0.000 | 0.000 | 0.115 | 0.000 | 0.000 | 0.329 | 0.556 | ||
| 1 spectrum, GEAEHLK | 0.000 | 0.000 | 0.000 | 0.314 | 0.019 | 0.000 | 0.405 | 0.261 |
| Plot | Mito | Lyso or Perox | ER | Golgi | PM | Cytosol | Nucleus | ||||||
| Expt B |
1 peptide |
1 spectrum |
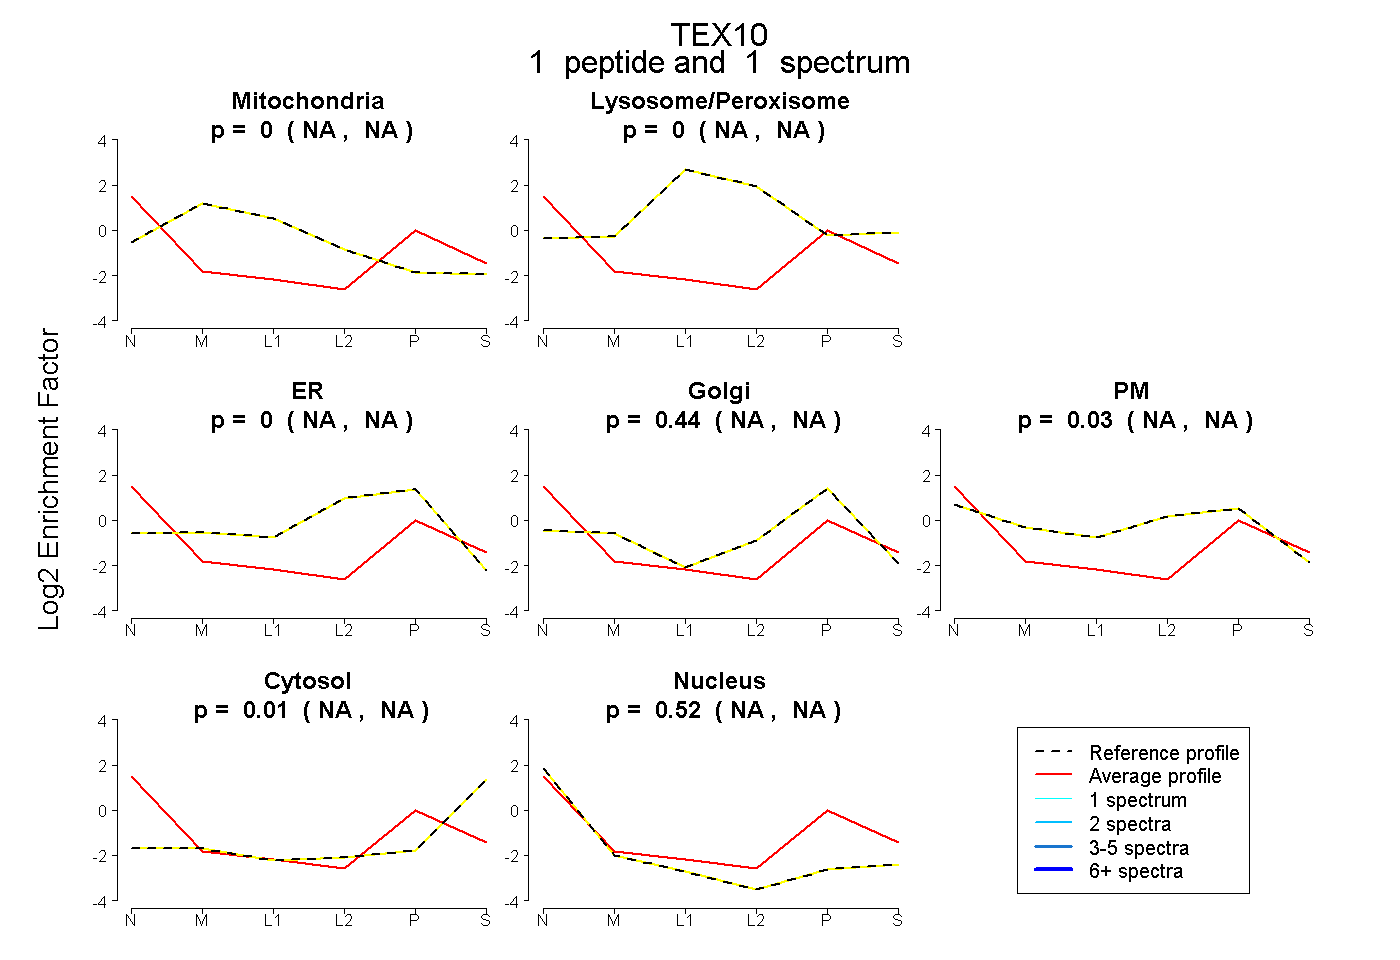 |
0.000 NA | NA |
0.000 NA | NA |
0.000 NA | NA |
0.444 NA | NA |
0.025 NA | NA |
0.008 NA | NA |
0.523 NA | NA |