 5
5peptides
spectra

0.000 | 0.000
0.155 | 0.232
0.141 | 0.261
0.068 | 0.158
0.000 | 0.000
0.331 | 0.418
0.080 | 0.124
0.000 | 0.000
5peptides
spectra

0.000 | 0.000
1.000 | 1.000
1peptide
spectrum
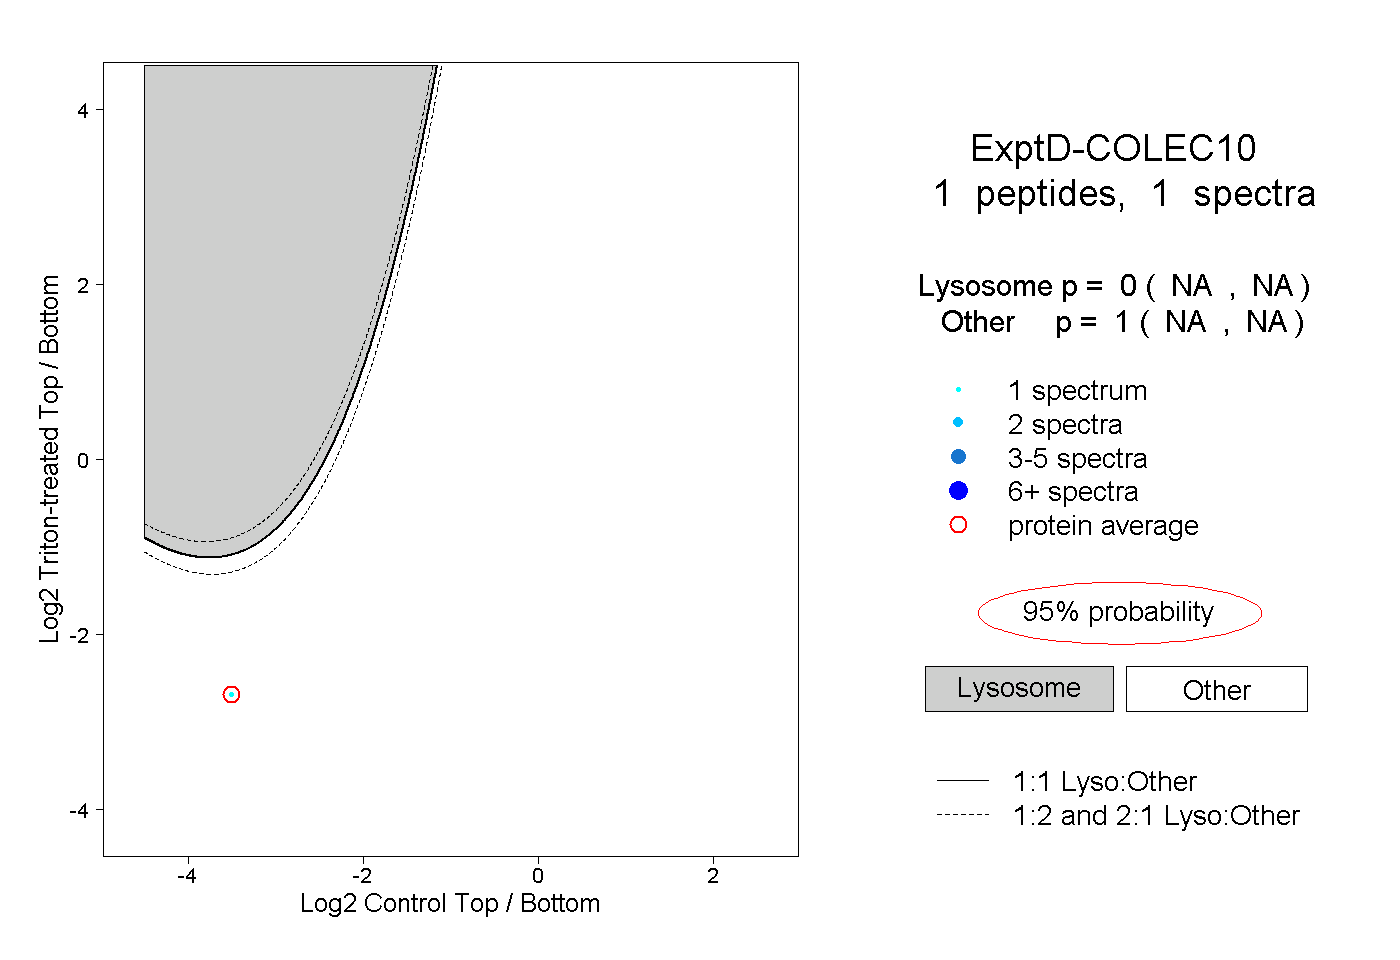
NA | NA
NA | NA