 5
5peptides
spectra

0.000 | 0.000
0.155 | 0.232
0.141 | 0.261
0.068 | 0.158
0.000 | 0.000
0.331 | 0.418
0.080 | 0.124
0.000 | 0.000
| Plot | Mito | Lyso | Perox | ER | Golgi | PM | Cytosol | Nucleus | |||||
| Expt A |
5 peptides |
16 spectra |
|
0.000 0.000 | 0.000 |
0.198 0.155 | 0.232 |
0.205 0.141 | 0.261 |
0.115 0.068 | 0.158 |
0.000 0.000 | 0.000 |
0.379 0.331 | 0.418 |
0.103 0.080 | 0.124 |
0.000 0.000 | 0.000 |
| 2 spectra, VVGQLDISVAR | 0.000 | 0.253 | 0.313 | 0.048 | 0.000 | 0.198 | 0.188 | 0.000 | ||
| 1 spectrum, FYYIVQEEK | 0.000 | 0.252 | 0.307 | 0.112 | 0.000 | 0.308 | 0.022 | 0.000 | ||
| 2 spectra, NVIAGIR | 0.000 | 0.370 | 0.225 | 0.000 | 0.000 | 0.364 | 0.041 | 0.000 | ||
| 1 spectrum, DEVVNTLIADYVAK | 0.000 | 0.239 | 0.290 | 0.000 | 0.000 | 0.358 | 0.113 | 0.000 | ||
| 10 spectra, AGTICDCGR | 0.000 | 0.000 | 0.000 | 0.617 | 0.051 | 0.182 | 0.150 | 0.000 |
| Plot | Lyso | Other | |||||||||||
| Expt C |
5 peptides |
24 spectra |
 |
0.000 0.000 | 0.000 |
1.000 1.000 | 1.000 |
||||||||
| Plot | Lyso | Other | |||||||||||
| Expt D |
1 peptide |
1 spectrum |
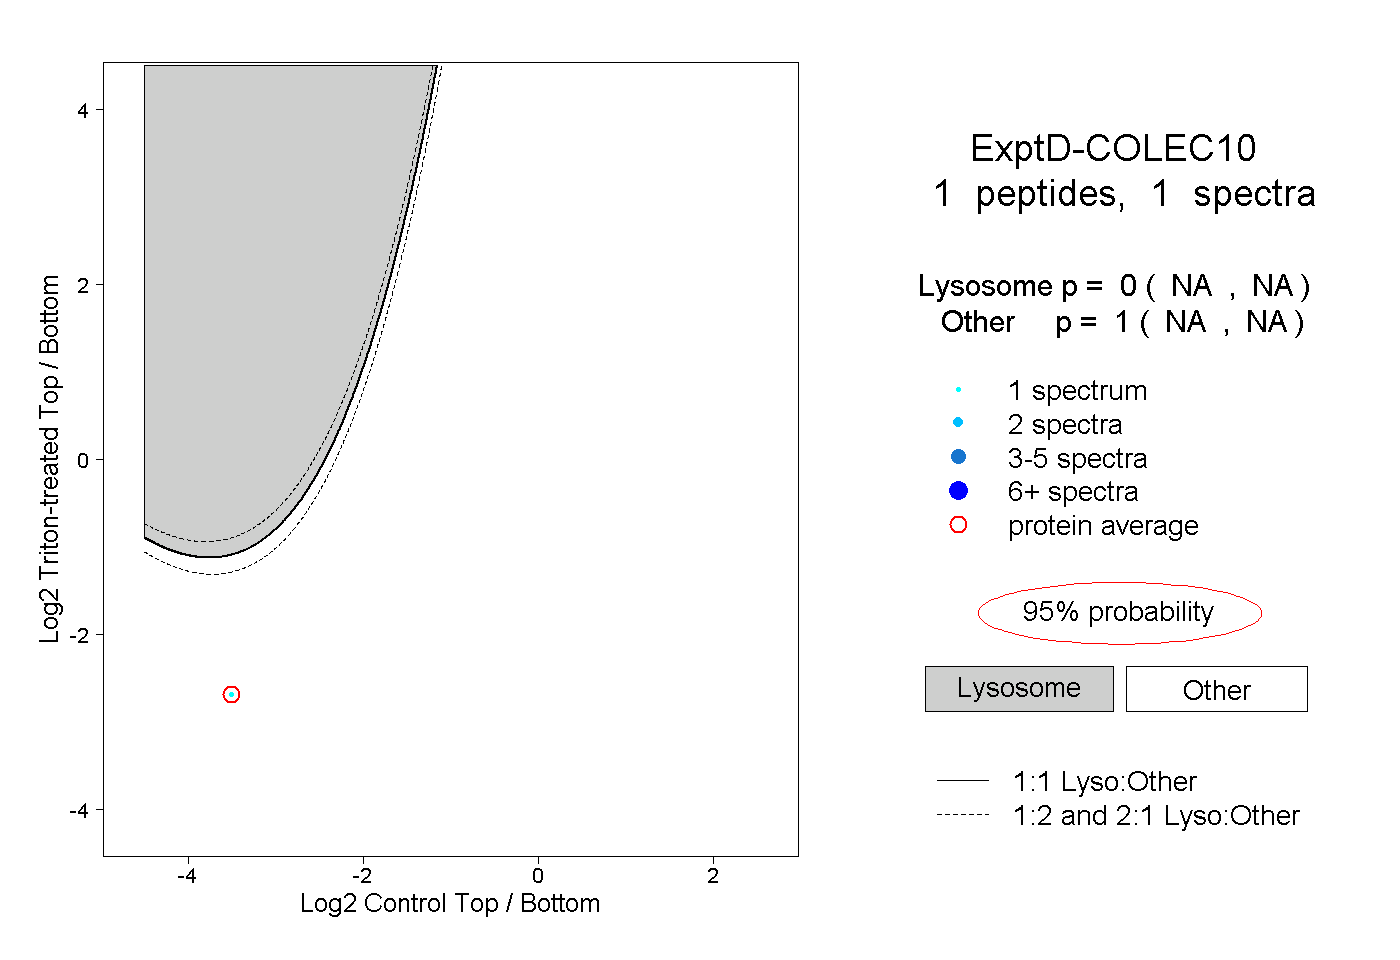 |
0.000 NA | NA |
1.000 NA | NA |