 12
12peptides
spectra
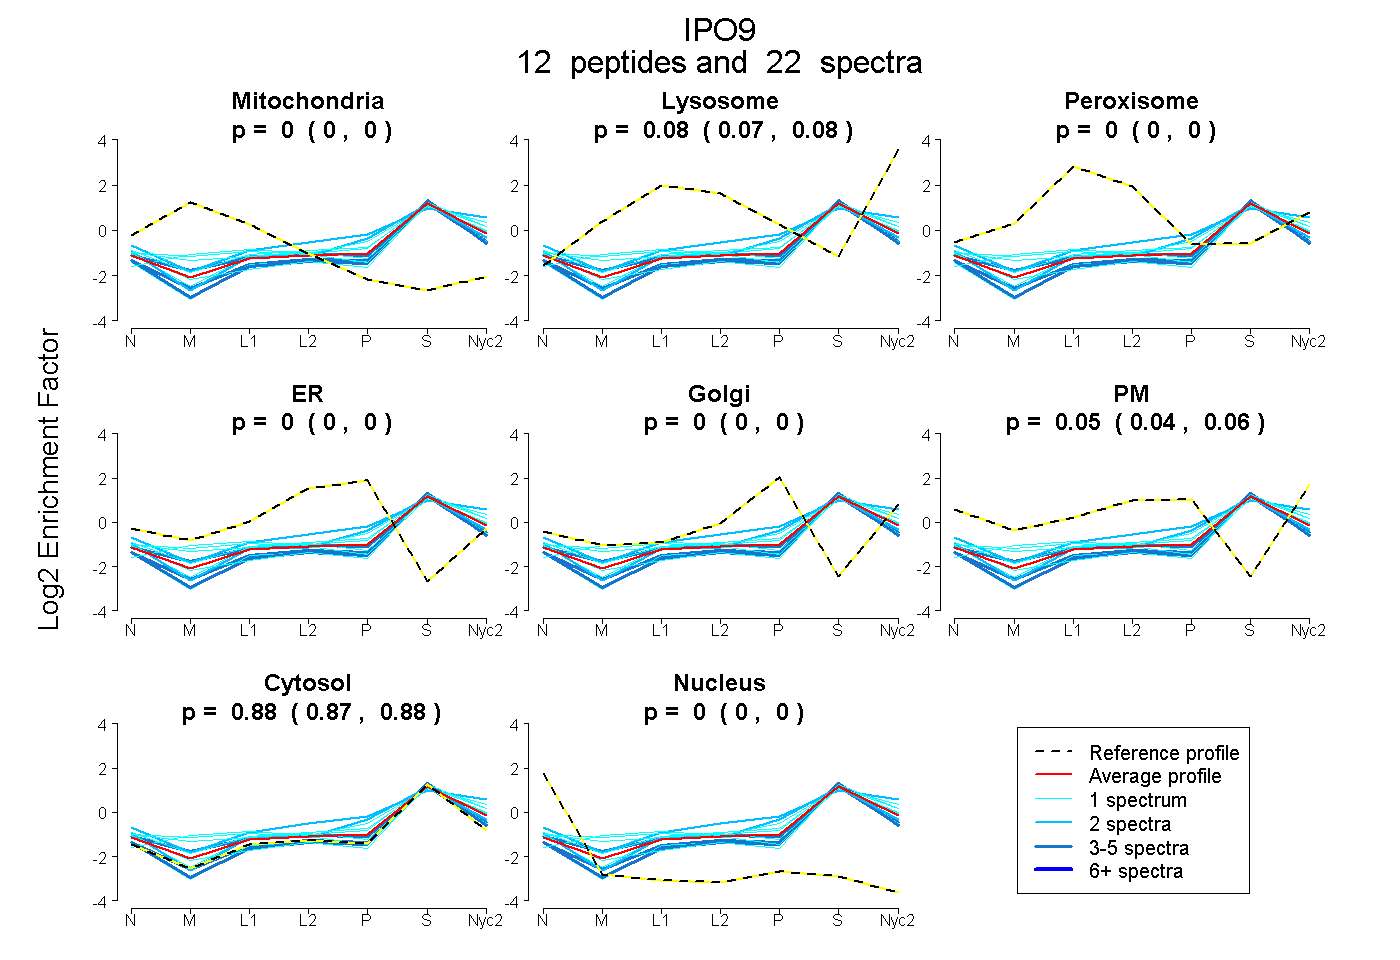
0.000 | 0.000
0.065 | 0.084
0.000 | 0.000
0.000 | 0.000
0.000 | 0.000
0.038 | 0.057
0.869 | 0.881
0.000 | 0.000
2peptides
spectra
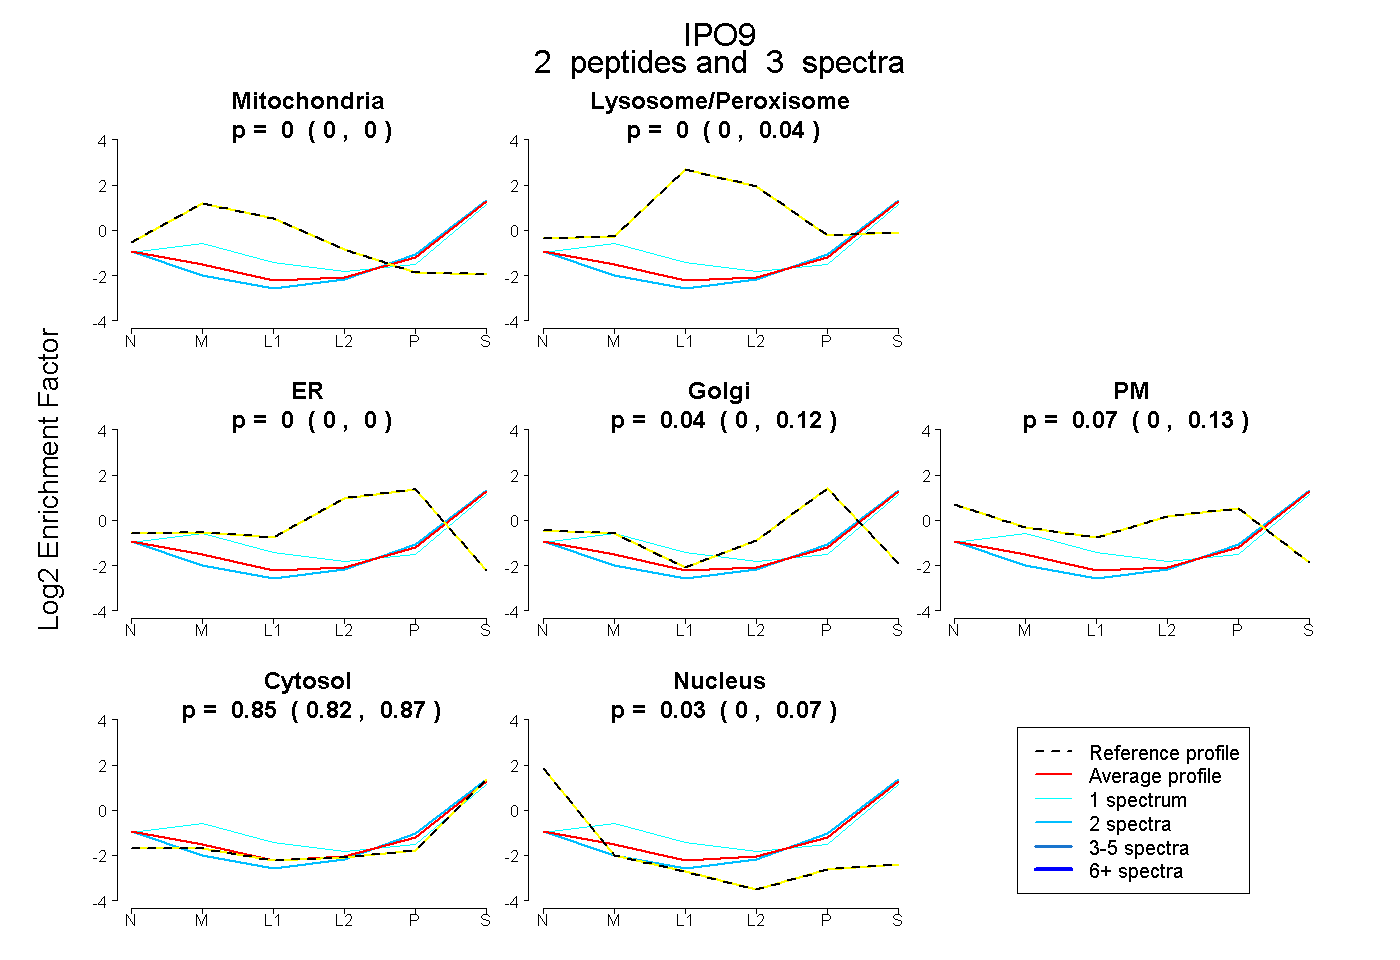
0.000 | 0.000
0.000 | 0.041
0.000 | 0.000
0.000 | 0.120
0.000 | 0.133
0.822 | 0.872
0.000 | 0.066
5peptides
spectra
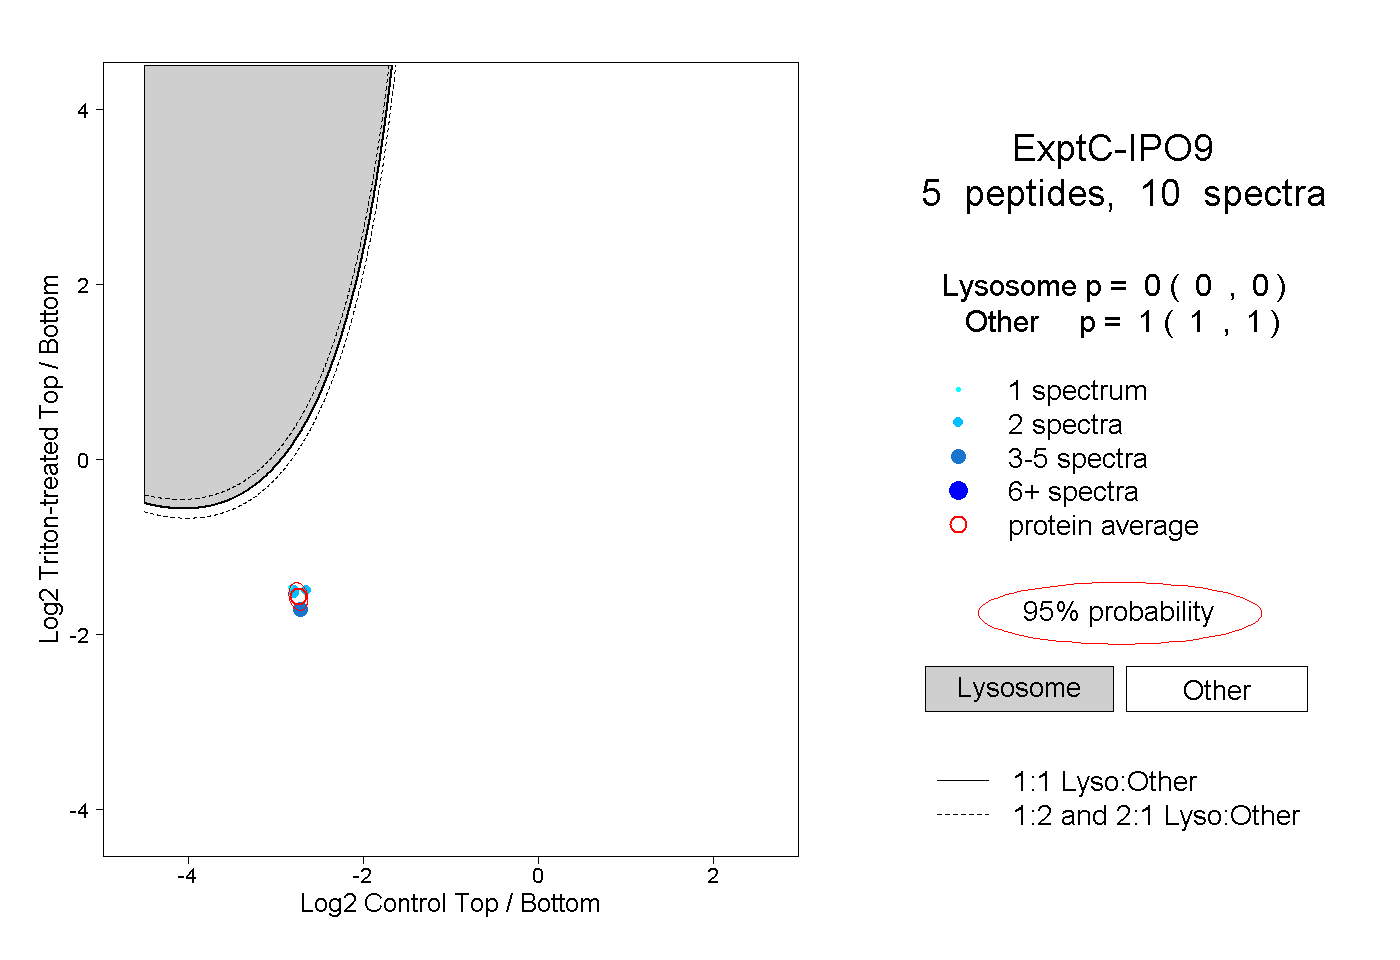
0.000 | 0.000
1.000 | 1.000