 8
8peptides
spectra
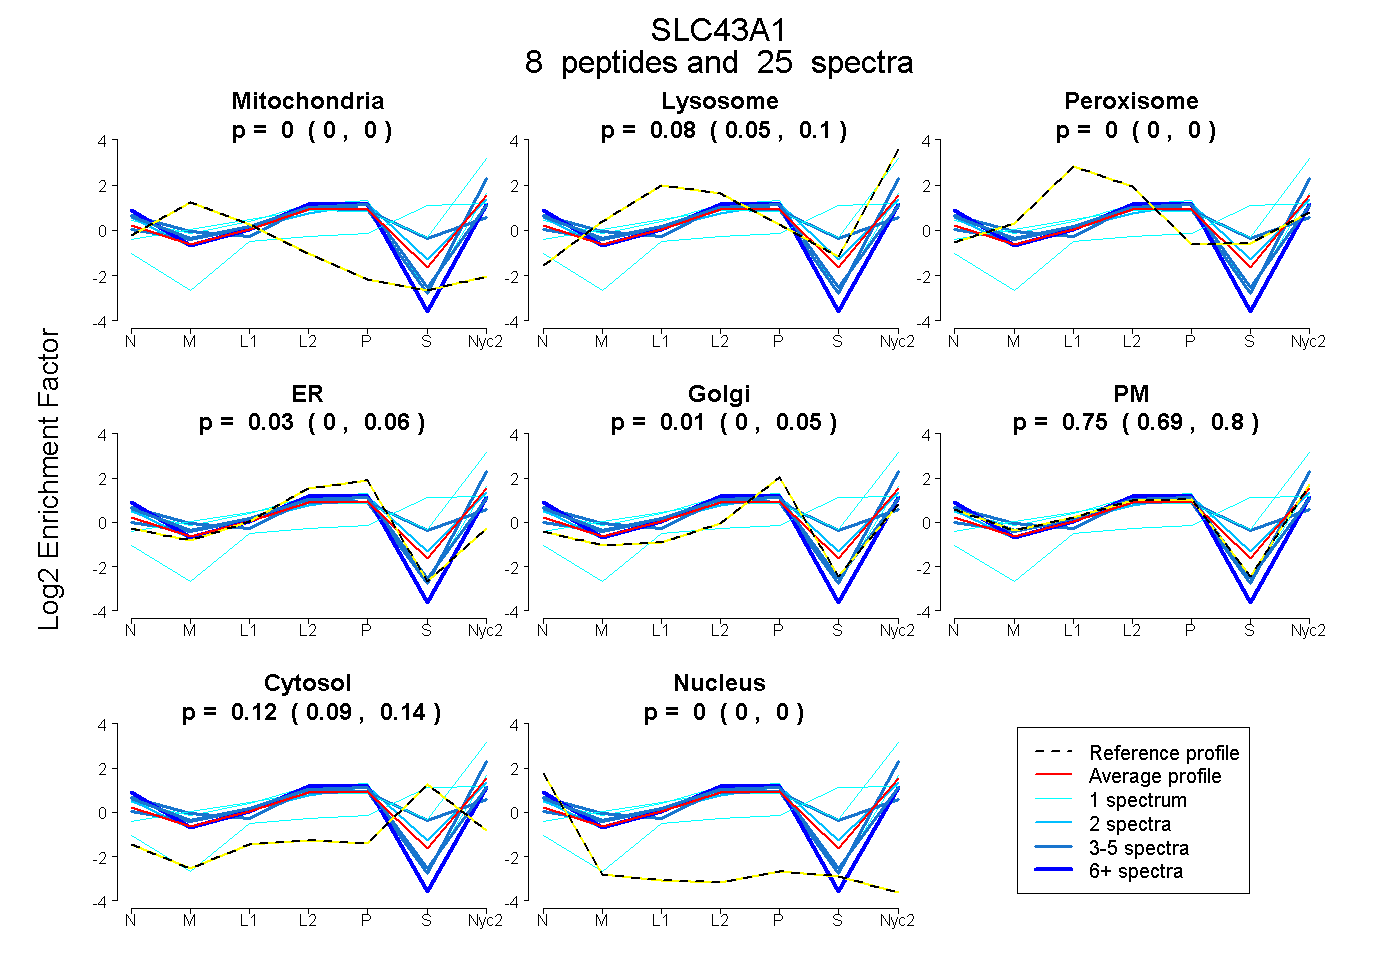
0.000 | 0.000
0.052 | 0.104
0.000 | 0.001
0.000 | 0.064
0.000 | 0.050
0.691 | 0.798
0.095 | 0.140
0.000 | 0.000
3peptides
spectra
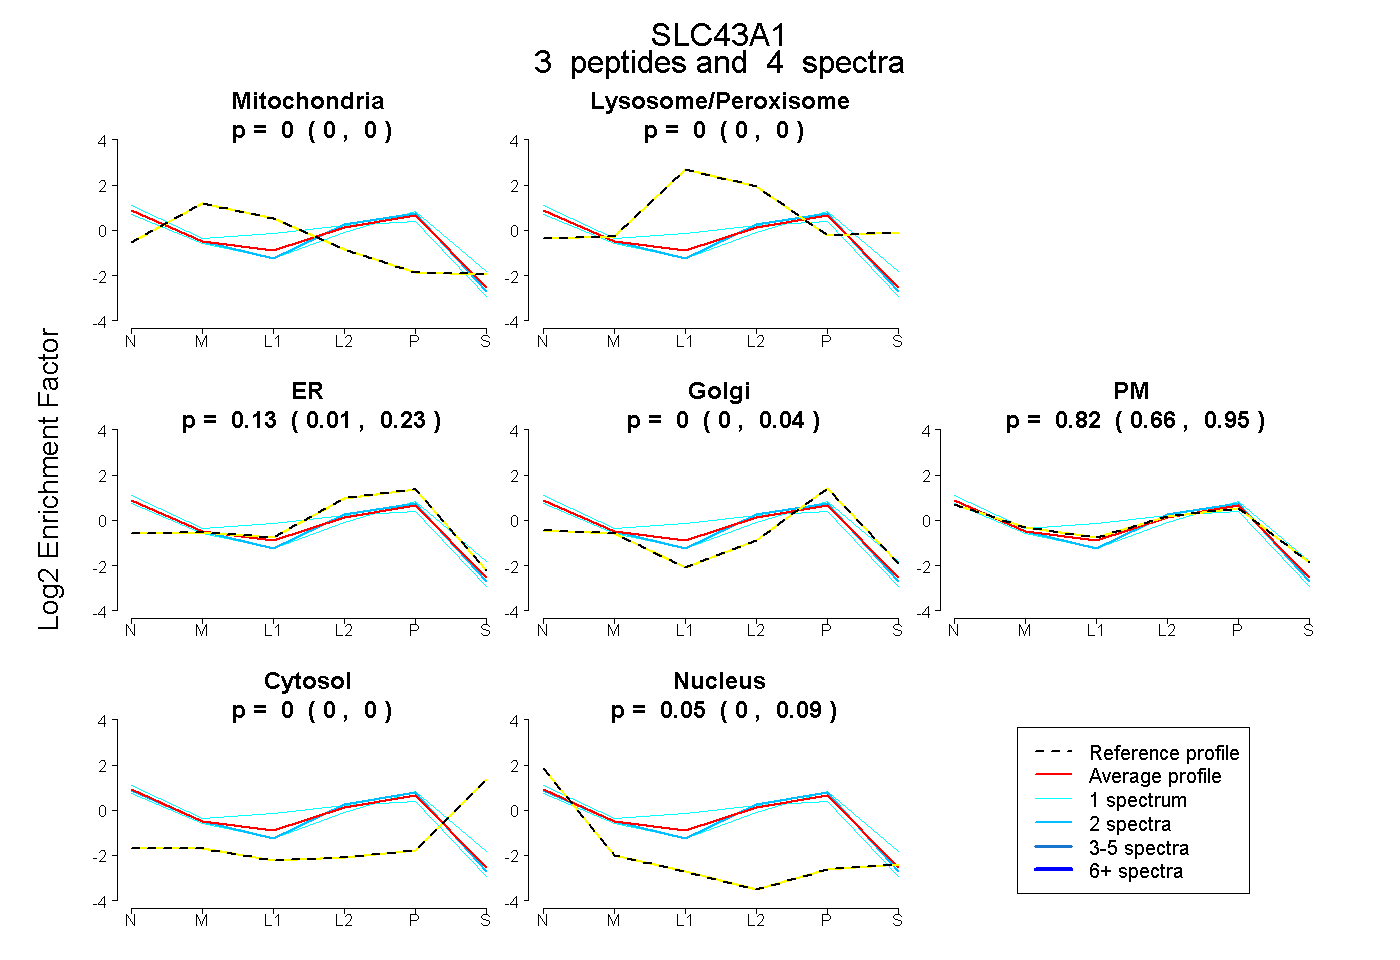
0.000 | 0.000
0.000 | 0.000
0.014 | 0.229
0.000 | 0.035
0.661 | 0.950
0.000 | 0.000
0.003 | 0.086
5peptides
spectra

0.000 | 0.000
1.000 | 1.000
2peptides
spectra
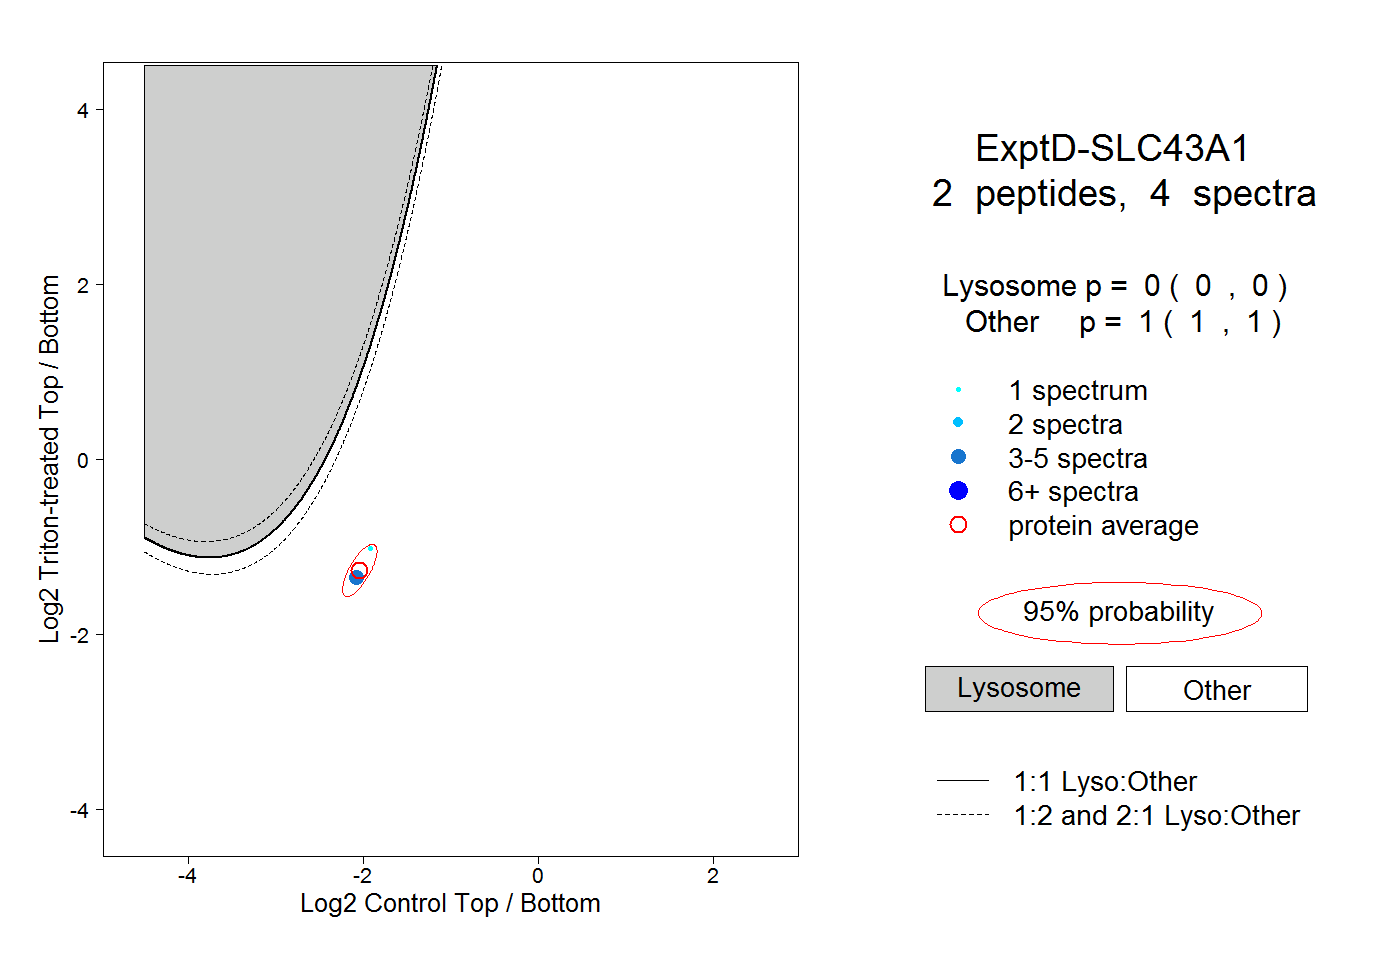
0.000 | 0.000
1.000 | 1.000