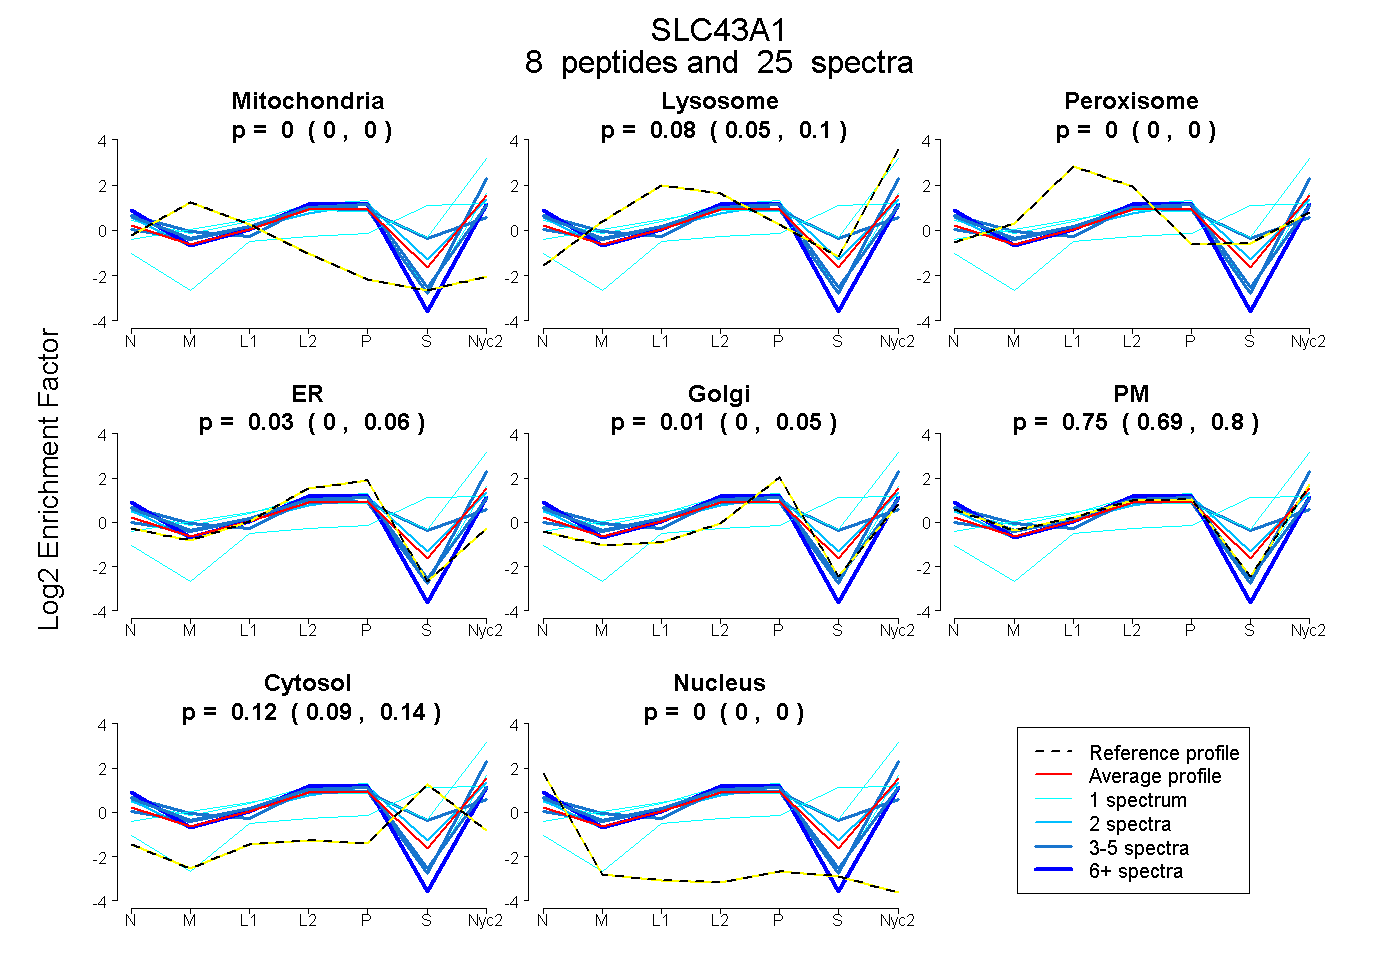
 8
8peptides
spectra
0.000 | 0.000
0.052 | 0.104
0.000 | 0.001
0.000 | 0.064
0.000 | 0.050
0.691 | 0.798
0.095 | 0.140
0.000 | 0.000
| Plot | Mito | Lyso | Perox | ER | Golgi | PM | Cytosol | Nucleus | |||||
| Expt A |
8 peptides |
25 spectra |
|
0.000 0.000 | 0.000 |
0.081 0.052 | 0.104 |
0.000 0.000 | 0.001 |
0.030 0.000 | 0.064 |
0.014 0.000 | 0.050 |
0.754 0.691 | 0.798 |
0.121 0.095 | 0.140 |
0.000 0.000 | 0.000 |
| 1 spectrum, ILEFLVTGGK | 0.000 | 0.594 | 0.000 | 0.000 | 0.027 | 0.256 | 0.124 | 0.000 | ||
| 6 spectra, LIGLALDHK | 0.000 | 0.000 | 0.000 | 0.202 | 0.000 | 0.761 | 0.000 | 0.037 | ||
| 2 spectra, EYATNLLDPQK | 0.000 | 0.000 | 0.042 | 0.000 | 0.037 | 0.786 | 0.135 | 0.000 | ||
| 5 spectra, FGPRPLR | 0.000 | 0.004 | 0.000 | 0.000 | 0.000 | 0.996 | 0.000 | 0.000 | ||
| 1 spectrum, VIFYMGAMNK | 0.000 | 0.274 | 0.000 | 0.000 | 0.045 | 0.000 | 0.682 | 0.000 | ||
| 5 spectra, VLNTSK | 0.023 | 0.000 | 0.000 | 0.182 | 0.000 | 0.781 | 0.000 | 0.014 | ||
| 4 spectra, FYTHVTIVGQR | 0.000 | 0.000 | 0.256 | 0.115 | 0.117 | 0.295 | 0.217 | 0.000 | ||
| 1 spectrum, DGTITK | 0.000 | 0.037 | 0.000 | 0.098 | 0.000 | 0.865 | 0.000 | 0.000 |
| Plot | Mito | Lyso or Perox | ER | Golgi | PM | Cytosol | Nucleus | ||||||
| Expt B |
3 peptides |
4 spectra |
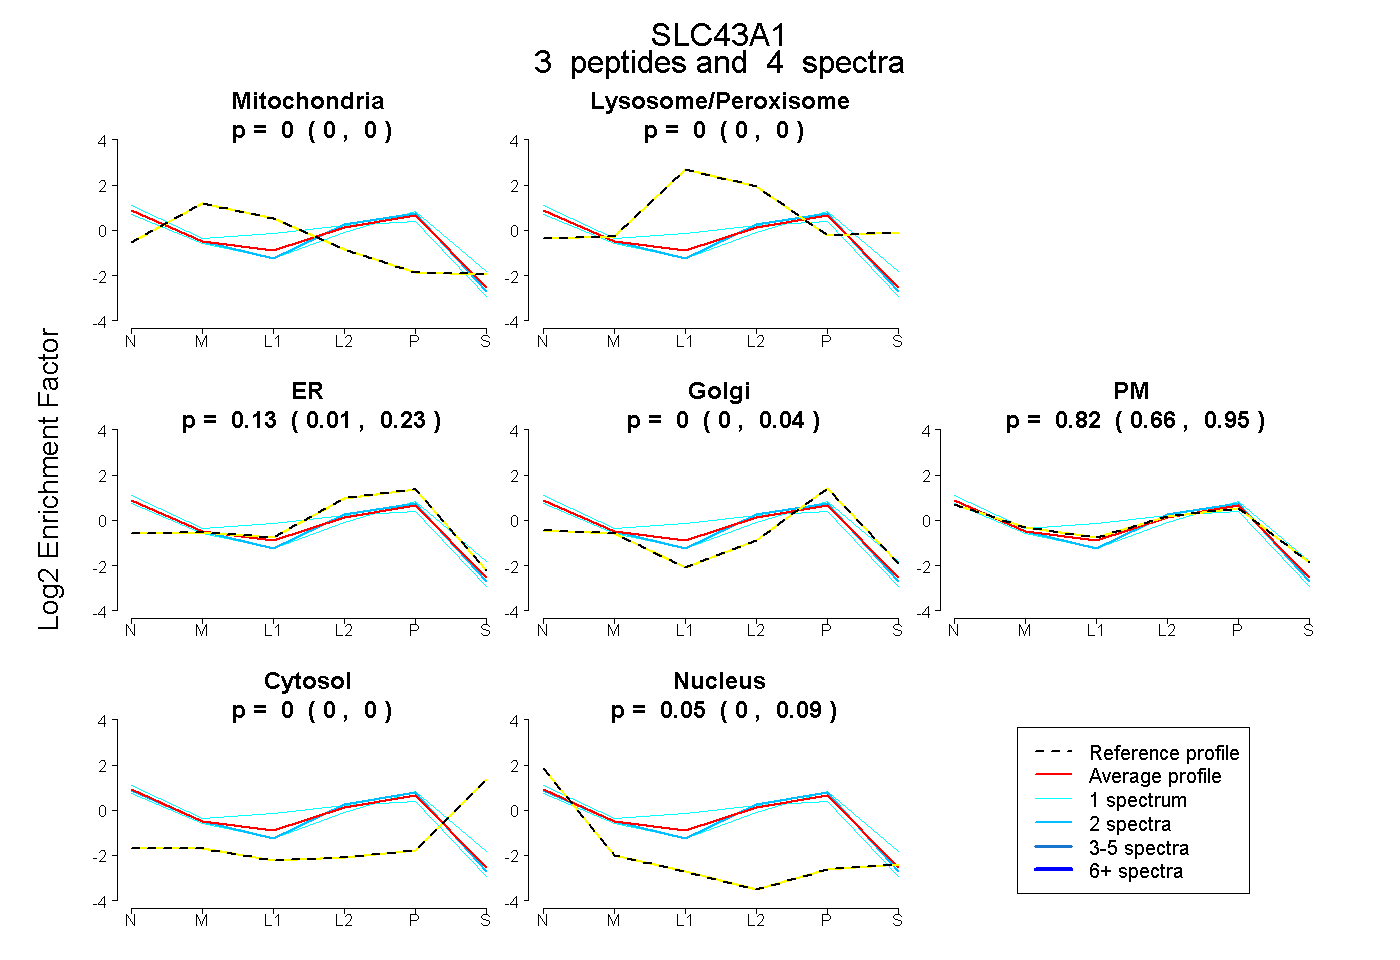 |
0.000 0.000 | 0.000 |
0.000 0.000 | 0.000 |
0.132 0.014 | 0.229 |
0.000 0.000 | 0.035 |
0.818 0.661 | 0.950 |
0.000 0.000 | 0.000 |
0.050 0.003 | 0.086 |
|||
| Plot | Lyso | Other | |||||||||||
| Expt C |
5 peptides |
19 spectra |
 |
0.000 0.000 | 0.000 |
1.000 1.000 | 1.000 |
||||||||
| Plot | Lyso | Other | |||||||||||
| Expt D |
2 peptides |
4 spectra |
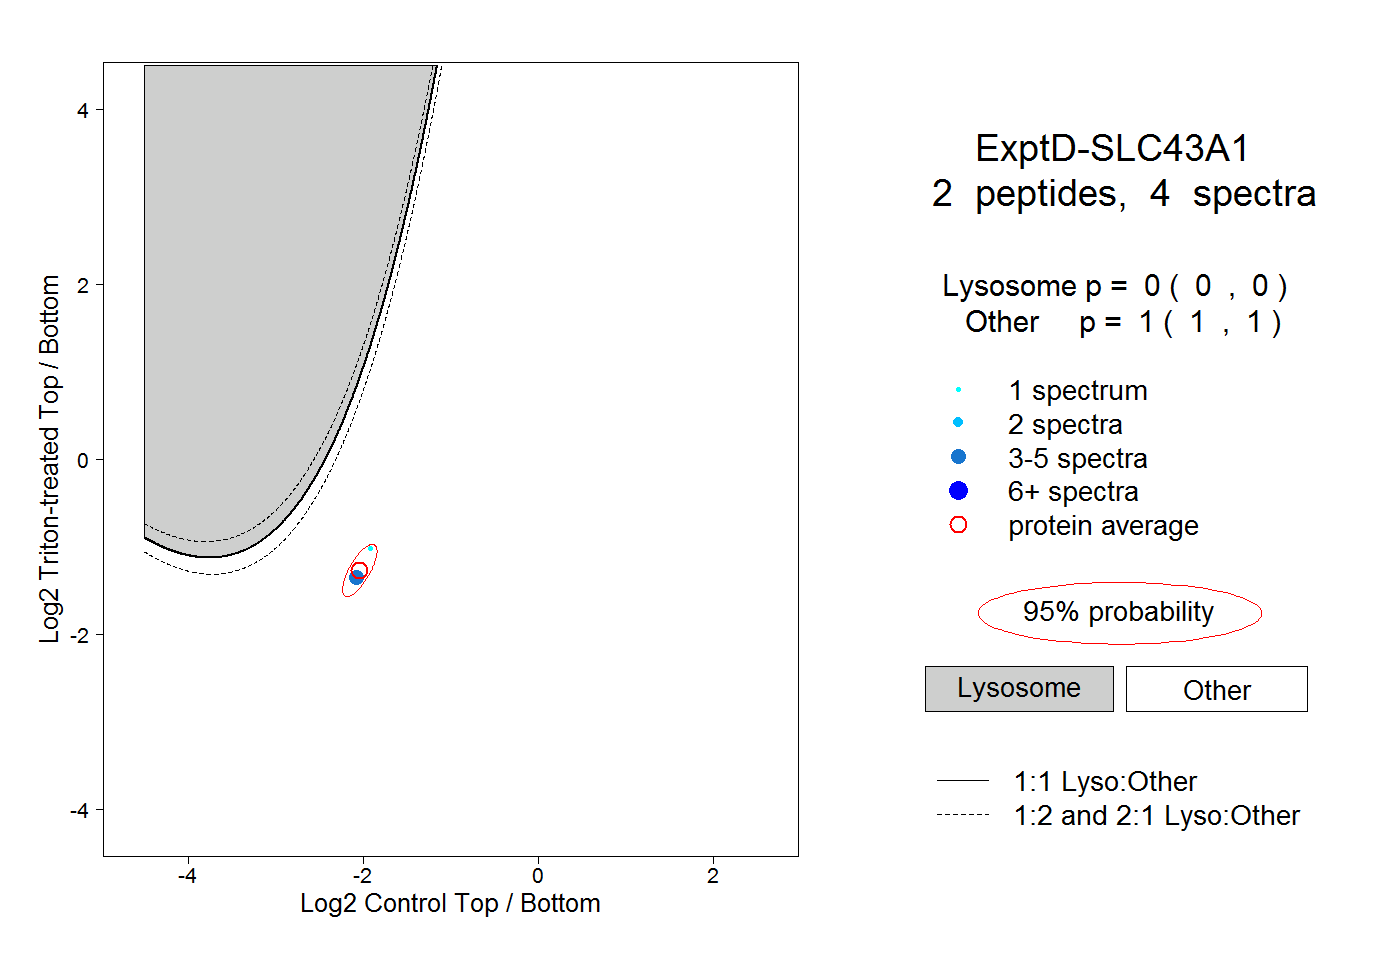 |
0.000 0.000 | 0.000 |
1.000 1.000 | 1.000 |