 8
8peptides
spectra
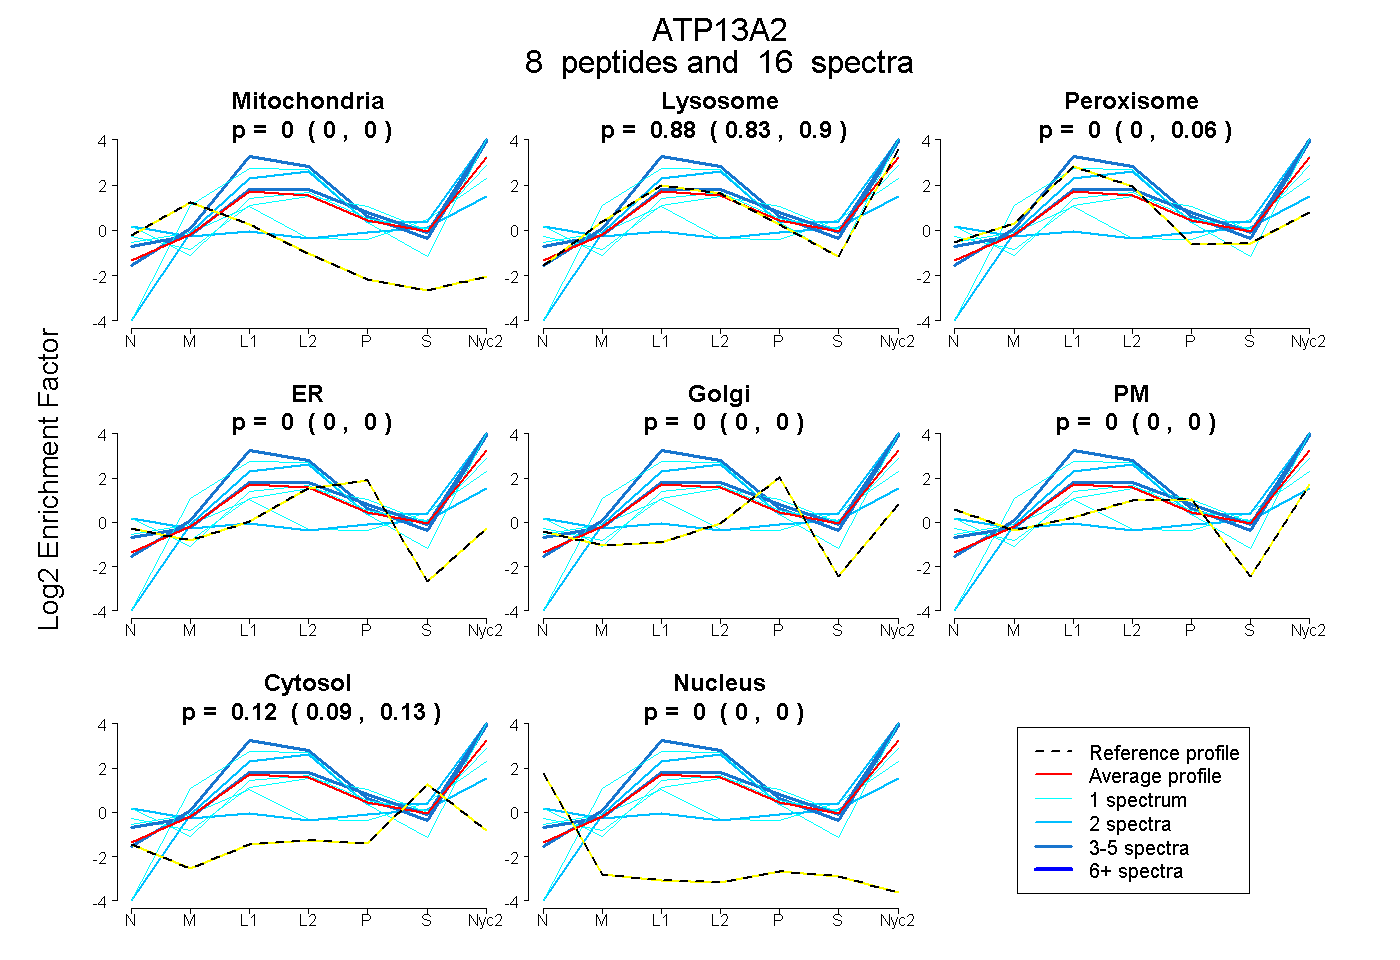
0.000 | 0.000
0.826 | 0.896
0.000 | 0.058
0.000 | 0.000
0.000 | 0.000
0.000 | 0.000
0.090 | 0.132
0.000 | 0.000
12peptides
spectra
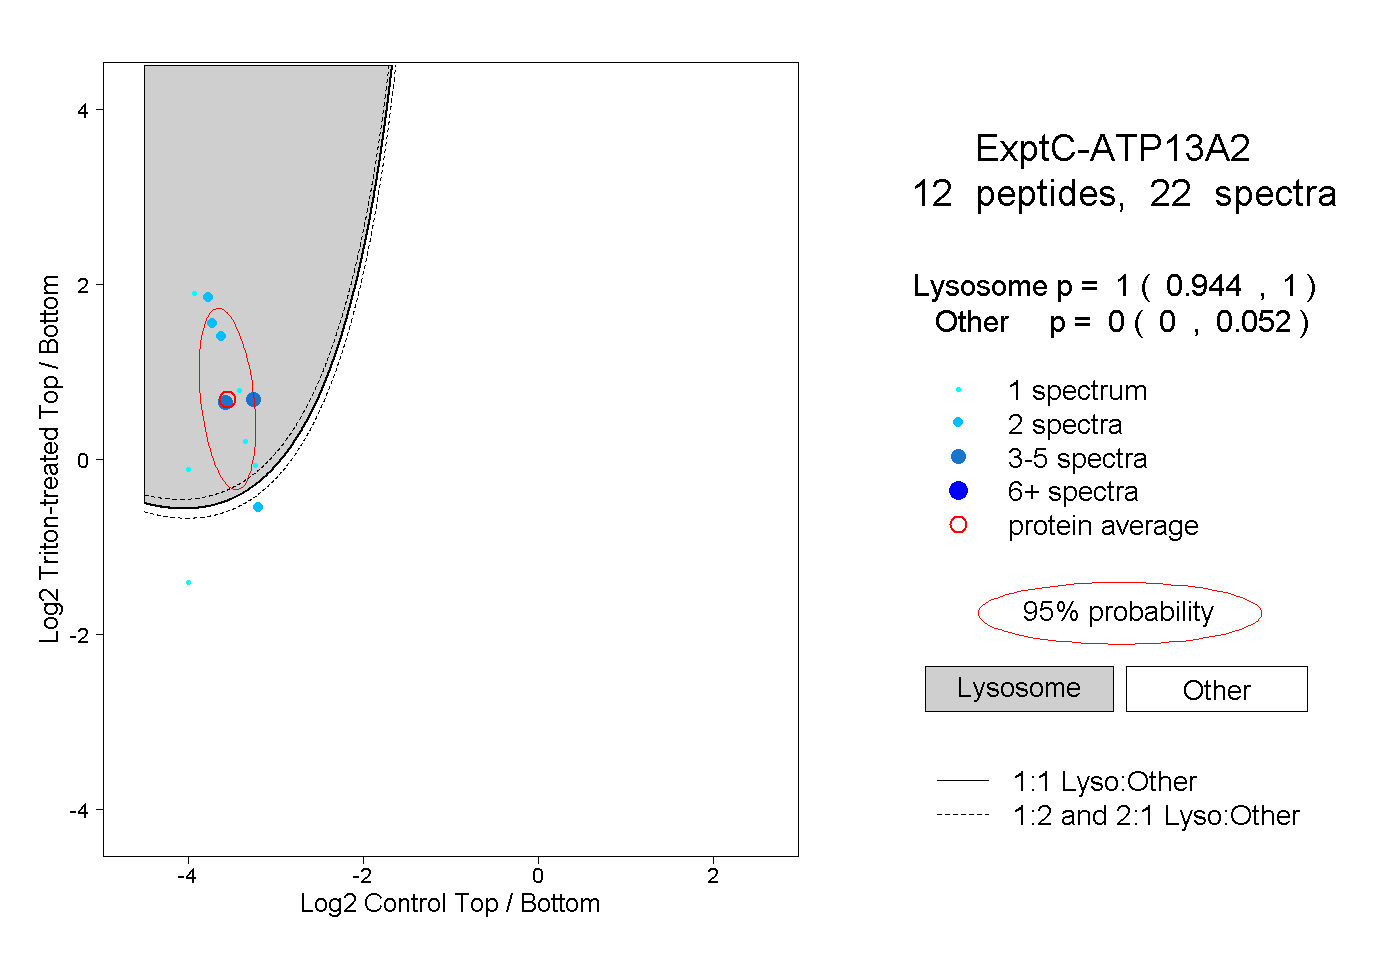
0.944 | 1.000
0.000 | 0.052
1peptide
spectrum
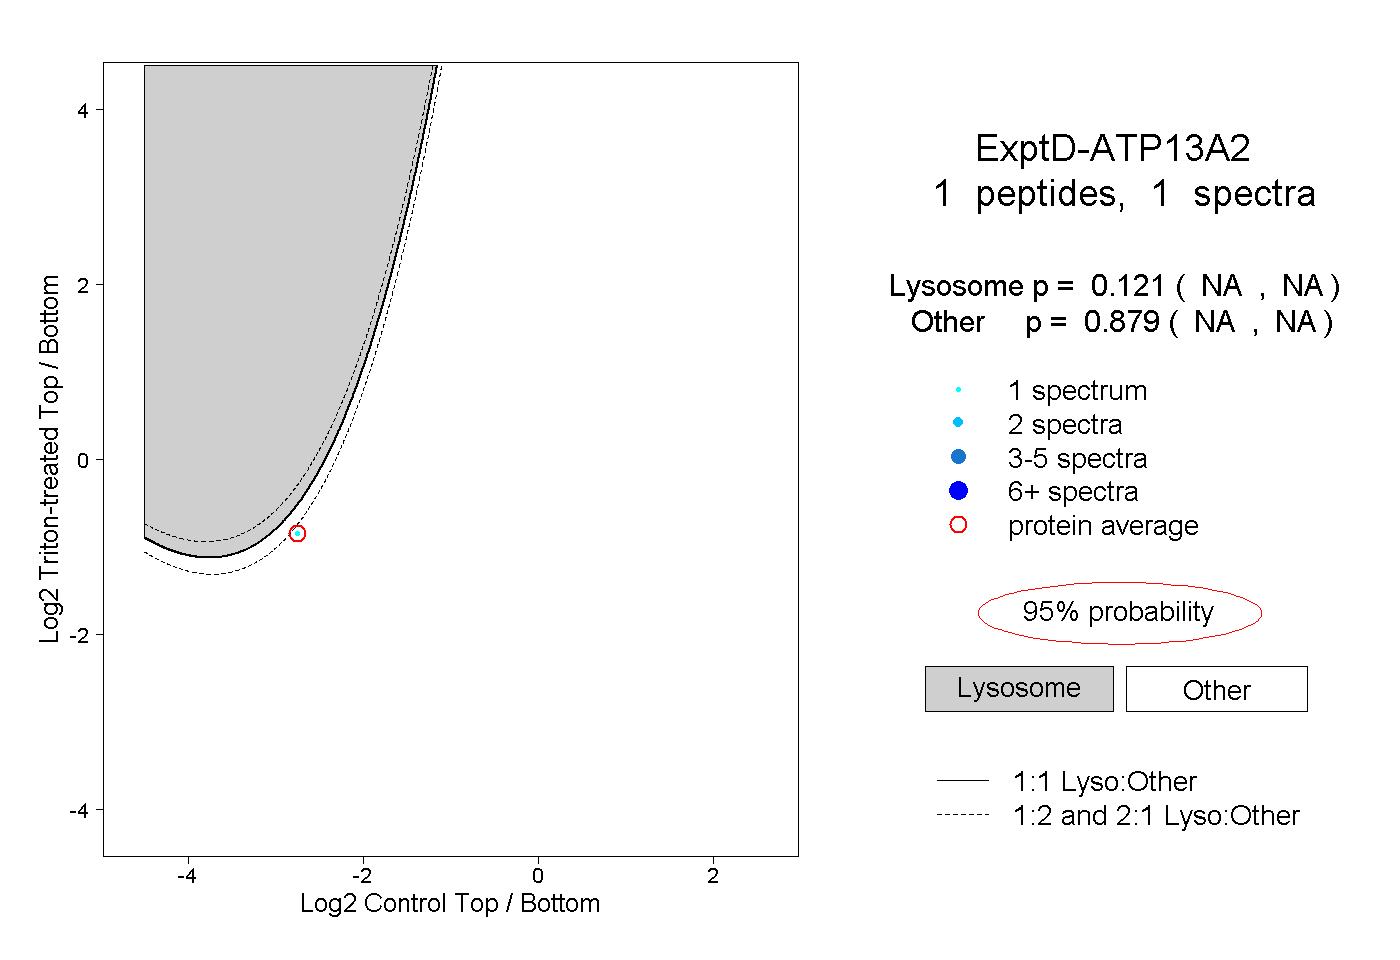
NA | NA
NA | NA