 8
8peptides
spectra
0.000 | 0.000
0.826 | 0.896
0.000 | 0.058
0.000 | 0.000
0.000 | 0.000
0.000 | 0.000
0.090 | 0.132
0.000 | 0.000
| Plot | Mito | Lyso | Perox | ER | Golgi | PM | Cytosol | Nucleus | |||||
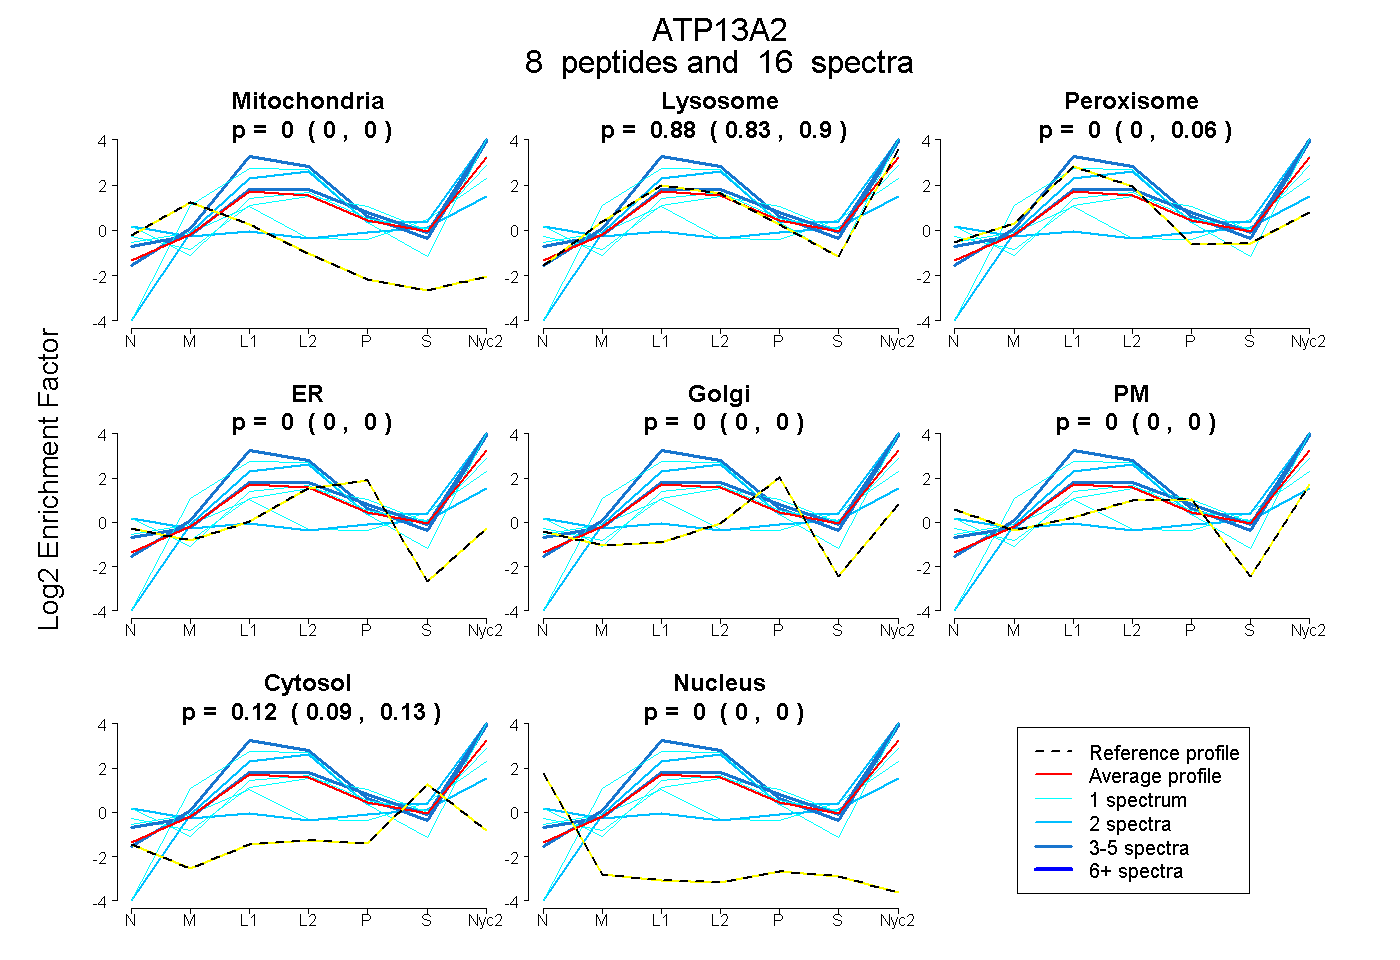
| Expt A |
8 peptides |
16 spectra |
|
0.000 0.000 | 0.000 |
0.883 0.826 | 0.896 |
0.001 0.000 | 0.058 |
0.000 0.000 | 0.000 |
0.000 0.000 | 0.000 |
0.000 0.000 | 0.000 |
0.116 0.090 | 0.132 |
0.000 0.000 | 0.000 |
| 4 spectra, VLAVVTR | 0.000 | 0.953 | 0.000 | 0.000 | 0.000 | 0.021 | 0.026 | 0.000 | ||
| 2 spectra, TGPALTLVR | 0.000 | 1.000 | 0.000 | 0.000 | 0.000 | 0.000 | 0.000 | 0.000 | ||
| 2 spectra, HLALSGSTFAVLQK | 0.006 | 0.236 | 0.000 | 0.000 | 0.000 | 0.367 | 0.391 | 0.000 | ||
| 1 spectrum, DFPQVLQSYTAAGYR | 0.007 | 0.599 | 0.035 | 0.000 | 0.000 | 0.000 | 0.359 | 0.000 | ||
| 1 spectrum, TQGIFCIHPLR | 0.000 | 0.522 | 0.123 | 0.000 | 0.000 | 0.228 | 0.128 | 0.000 | ||
| 4 spectra, LRPCSLAR | 0.000 | 0.947 | 0.053 | 0.000 | 0.000 | 0.000 | 0.000 | 0.000 | ||
| 1 spectrum, VLVQATVFAR | 0.000 | 1.000 | 0.000 | 0.000 | 0.000 | 0.000 | 0.000 | 0.000 | ||
| 1 spectrum, TIYGPNVIGIPVK | 0.000 | 0.653 | 0.000 | 0.000 | 0.000 | 0.230 | 0.117 | 0.000 |
| Plot | Lyso | Other | |||||||||||
| Expt C |
12 peptides |
22 spectra |
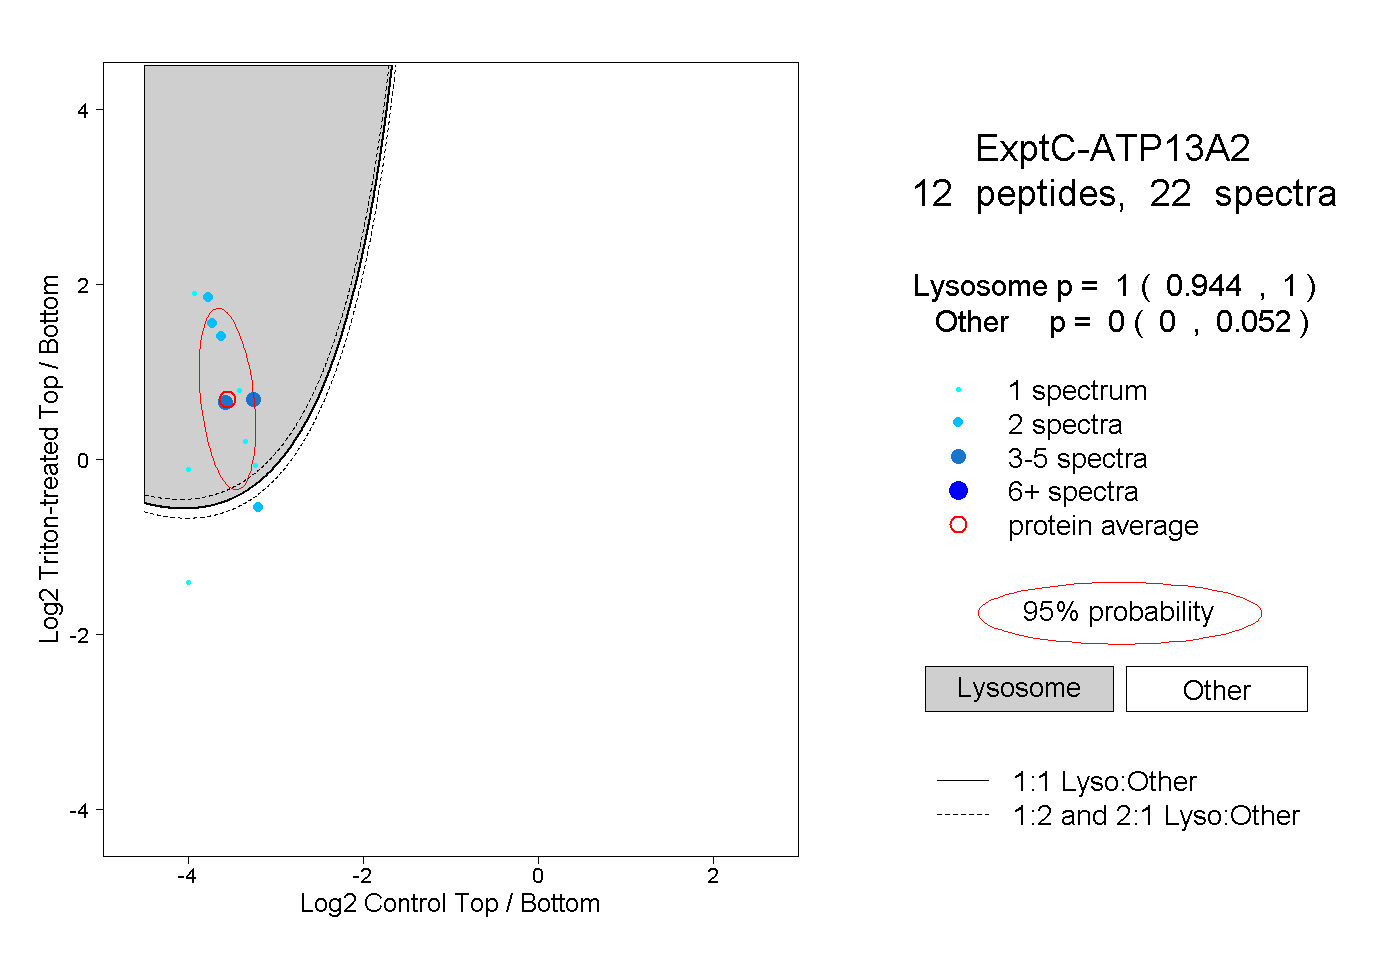 |
1.000 0.944 | 1.000 |
0.000 0.000 | 0.052 |
||||||||
| Plot | Lyso | Other | |||||||||||
| Expt D |
1 peptide |
1 spectrum |
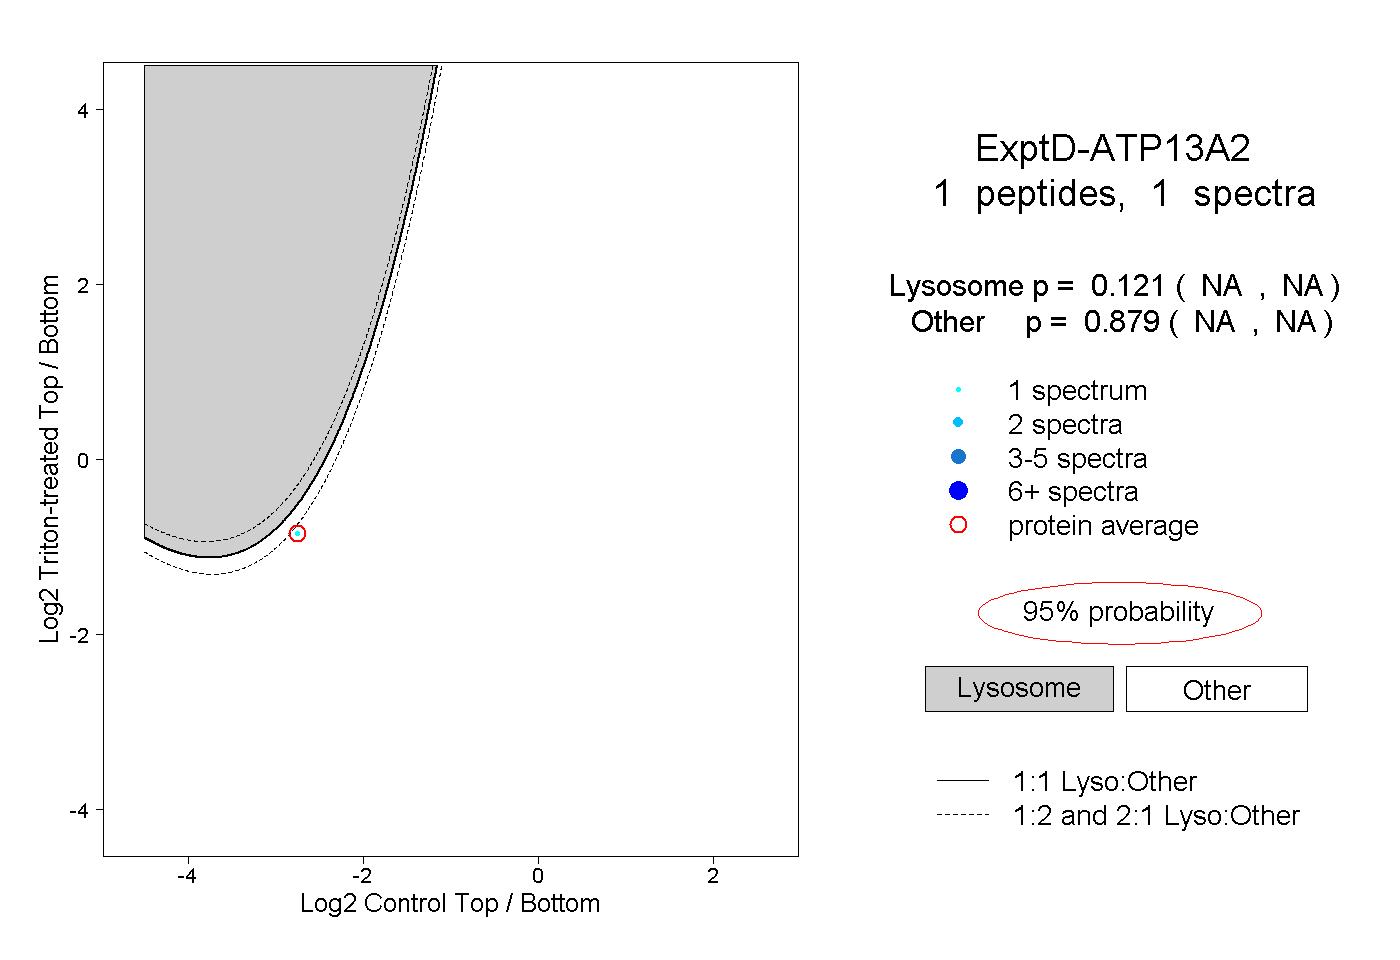 |
0.121 NA | NA |
0.879 NA | NA |