 4
4peptides
spectra
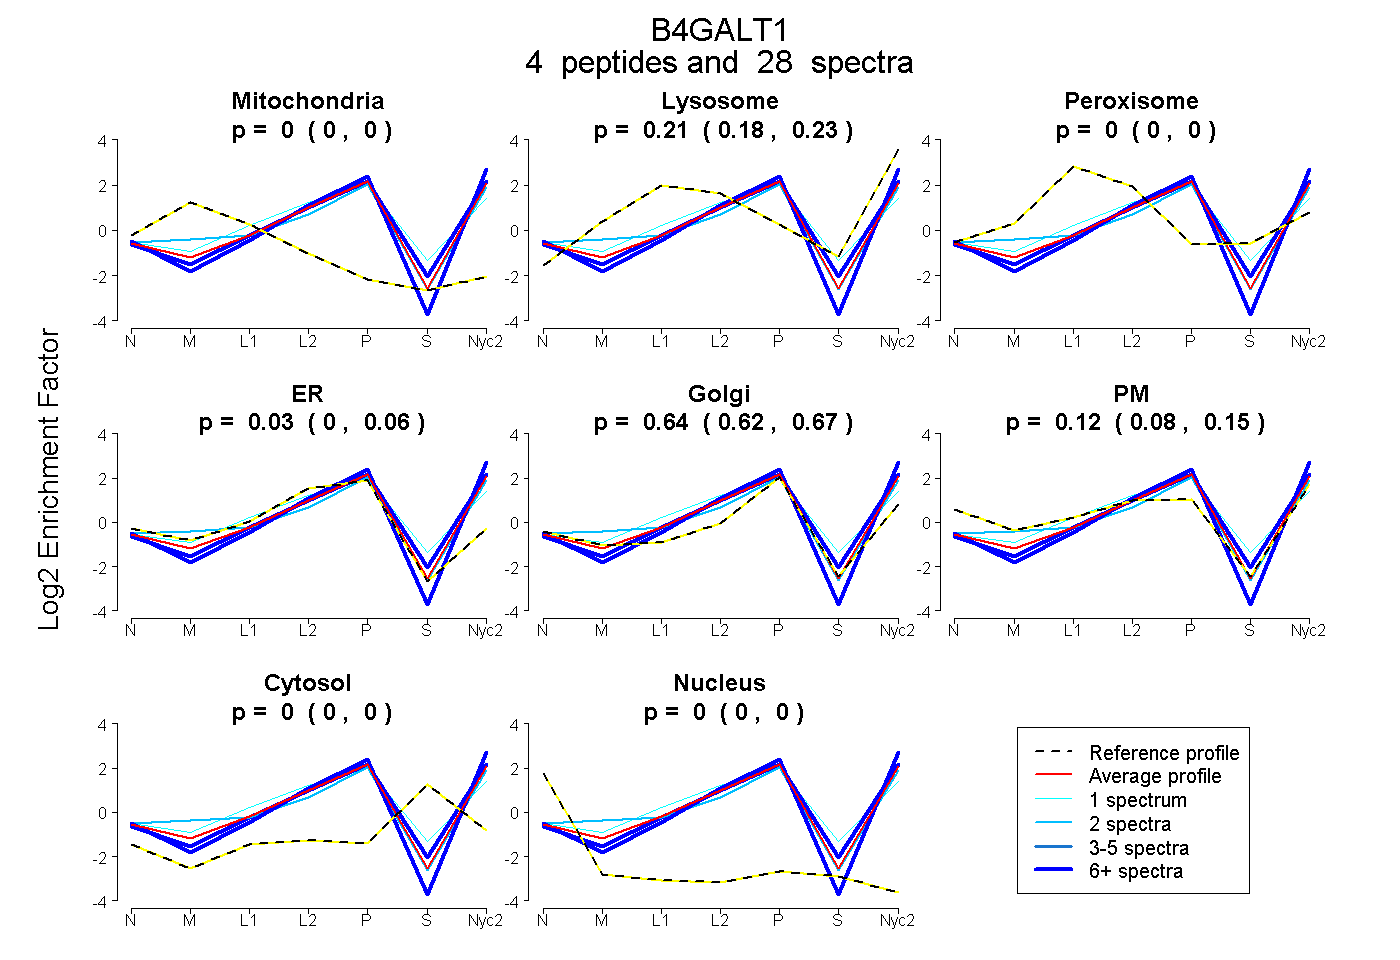
0.000 | 0.000
0.185 | 0.229
0.000 | 0.000
0.000 | 0.057
0.616 | 0.667
0.079 | 0.153
0.000 | 0.000
0.000 | 0.000
2peptides
spectra
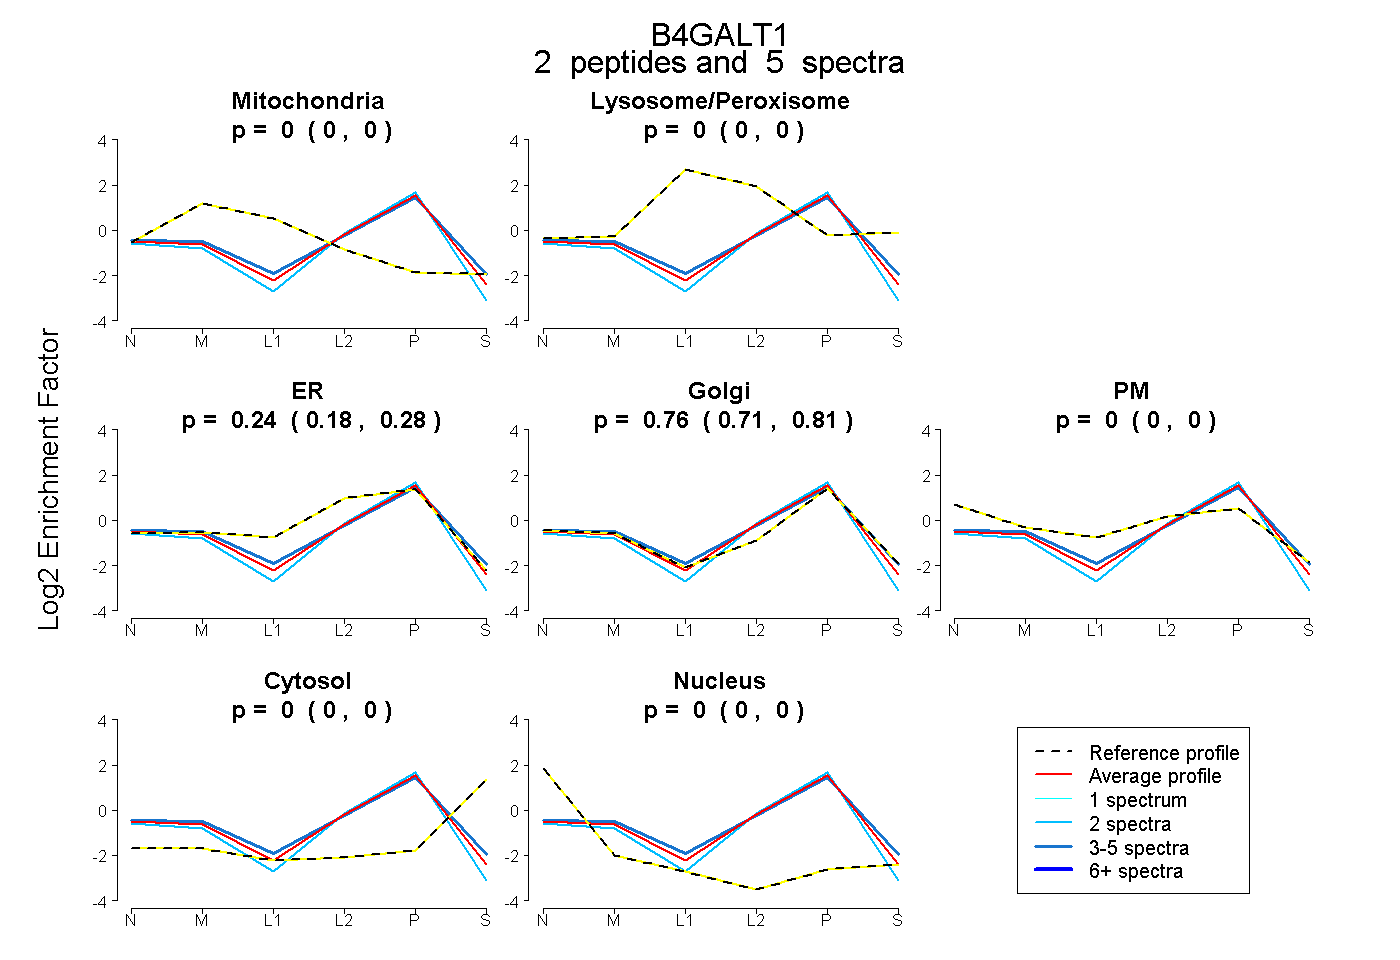
0.000 | 0.000
0.000 | 0.000
0.184 | 0.279
0.712 | 0.808
0.000 | 0.000
0.000 | 0.000
0.000 | 0.000
7peptides
spectra
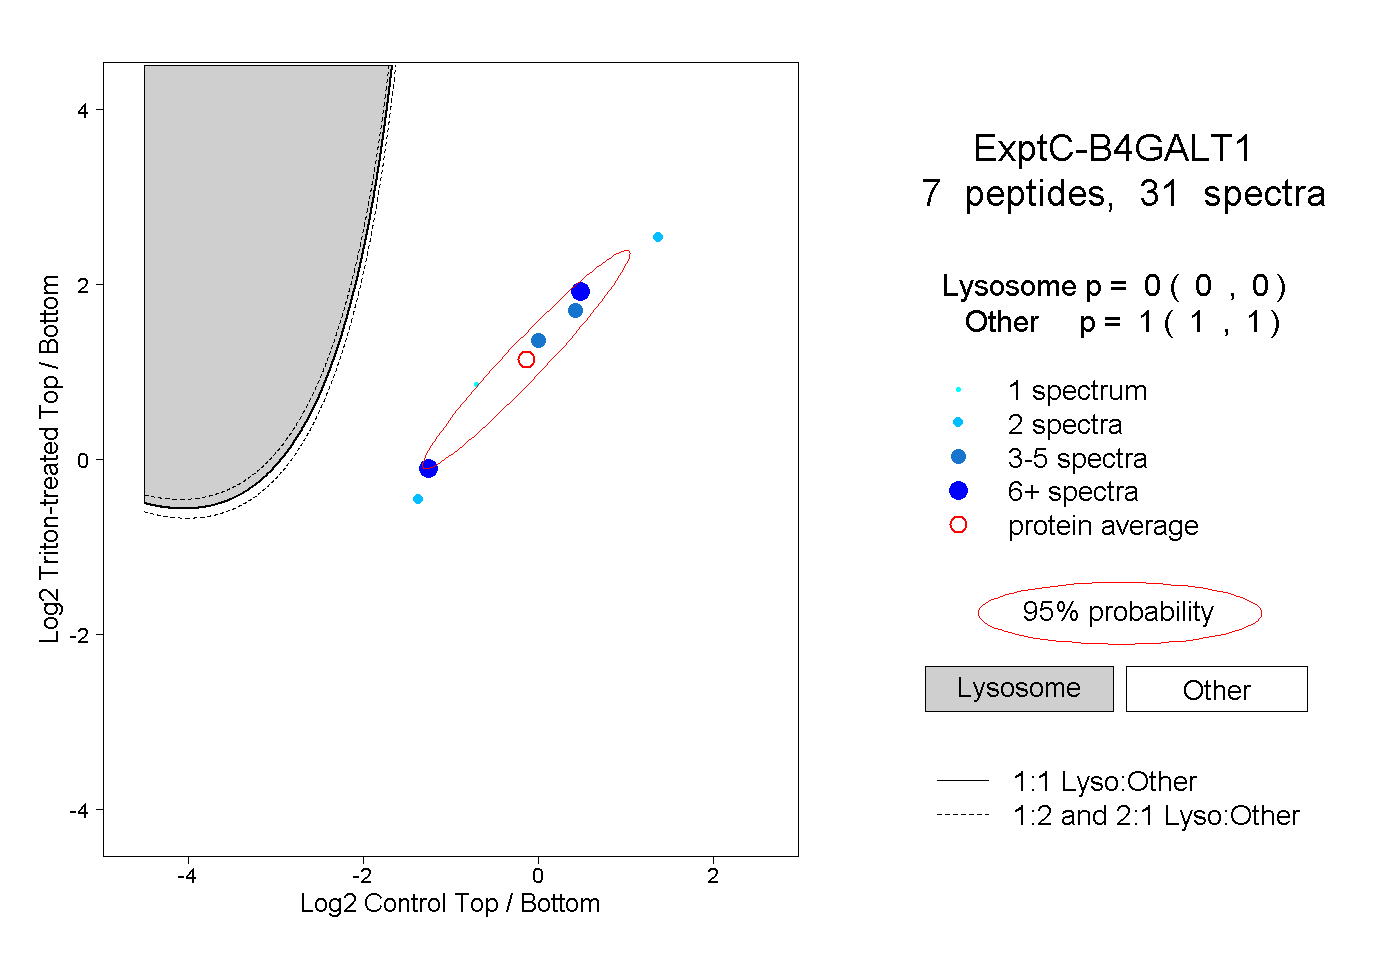
0.000 | 0.000
1.000 | 1.000