 4
4peptides
spectra
0.000 | 0.000
0.185 | 0.229
0.000 | 0.000
0.000 | 0.057
0.616 | 0.667
0.079 | 0.153
0.000 | 0.000
0.000 | 0.000
| Plot | Mito | Lyso | Perox | ER | Golgi | PM | Cytosol | Nucleus | |||||
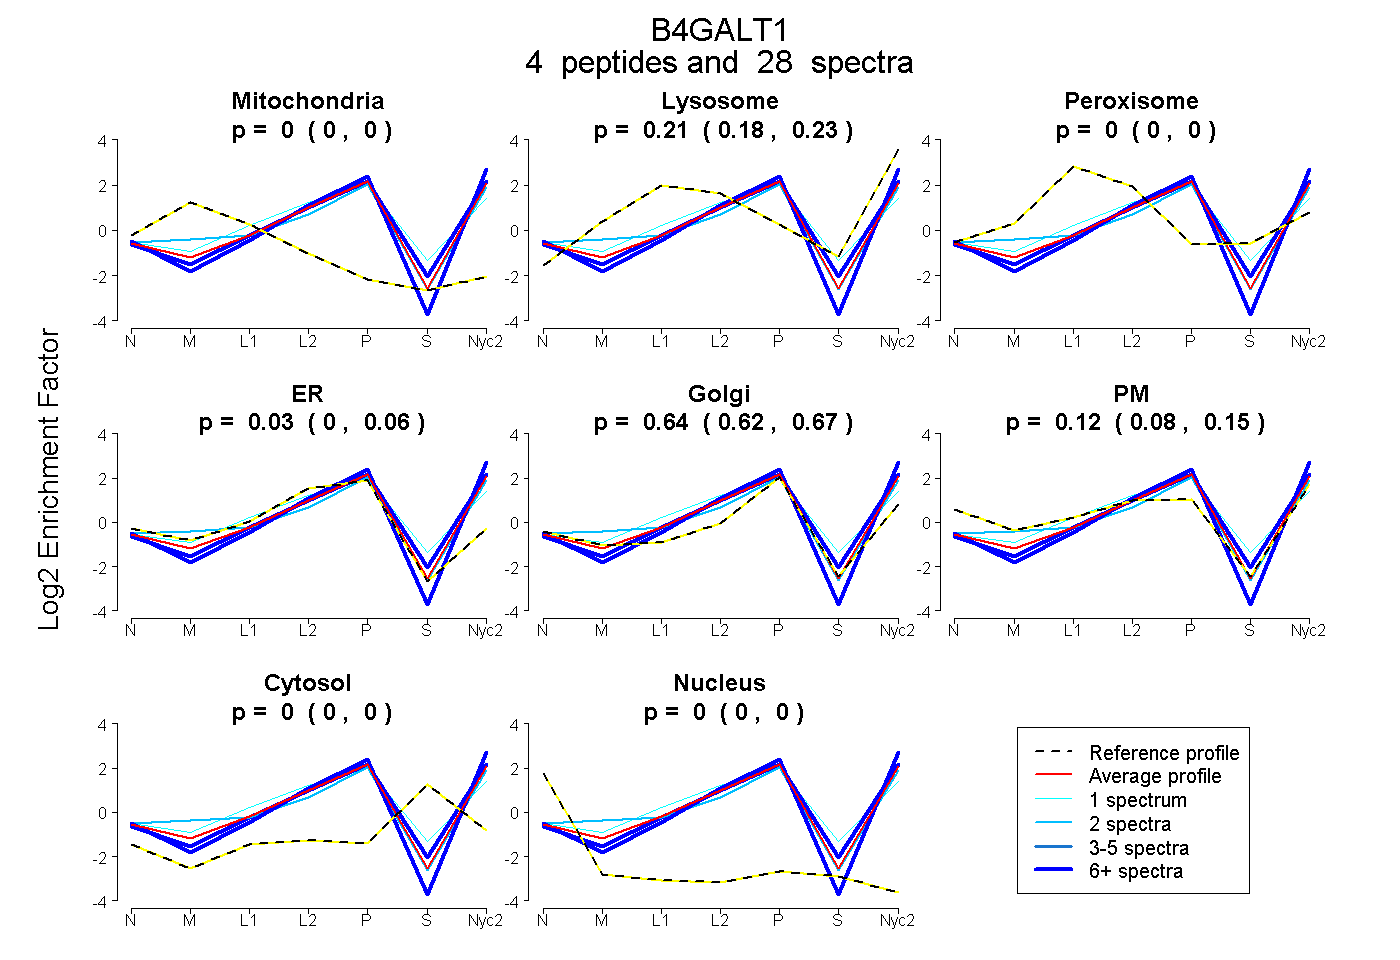
| Expt A |
4 peptides |
28 spectra |
|
0.000 0.000 | 0.000 |
0.209 0.185 | 0.229 |
0.000 0.000 | 0.000 |
0.029 0.000 | 0.057 |
0.644 0.616 | 0.667 |
0.118 0.079 | 0.153 |
0.000 0.000 | 0.000 |
0.000 0.000 | 0.000 |
| 2 spectra, ITVDIGTPR | 0.000 | 0.198 | 0.000 | 0.000 | 0.604 | 0.198 | 0.000 | 0.000 | ||
| 17 spectra, GMSISRPNAVVGR | 0.000 | 0.266 | 0.000 | 0.000 | 0.734 | 0.000 | 0.000 | 0.000 | ||
| 1 spectrum, DCISPHK | 0.000 | 0.293 | 0.000 | 0.320 | 0.354 | 0.000 | 0.033 | 0.000 | ||
| 8 spectra, VAILIPFR | 0.000 | 0.090 | 0.000 | 0.000 | 0.606 | 0.304 | 0.000 | 0.000 |
| Plot | Mito | Lyso or Perox | ER | Golgi | PM | Cytosol | Nucleus | ||||||
| Expt B |
2 peptides |
5 spectra |
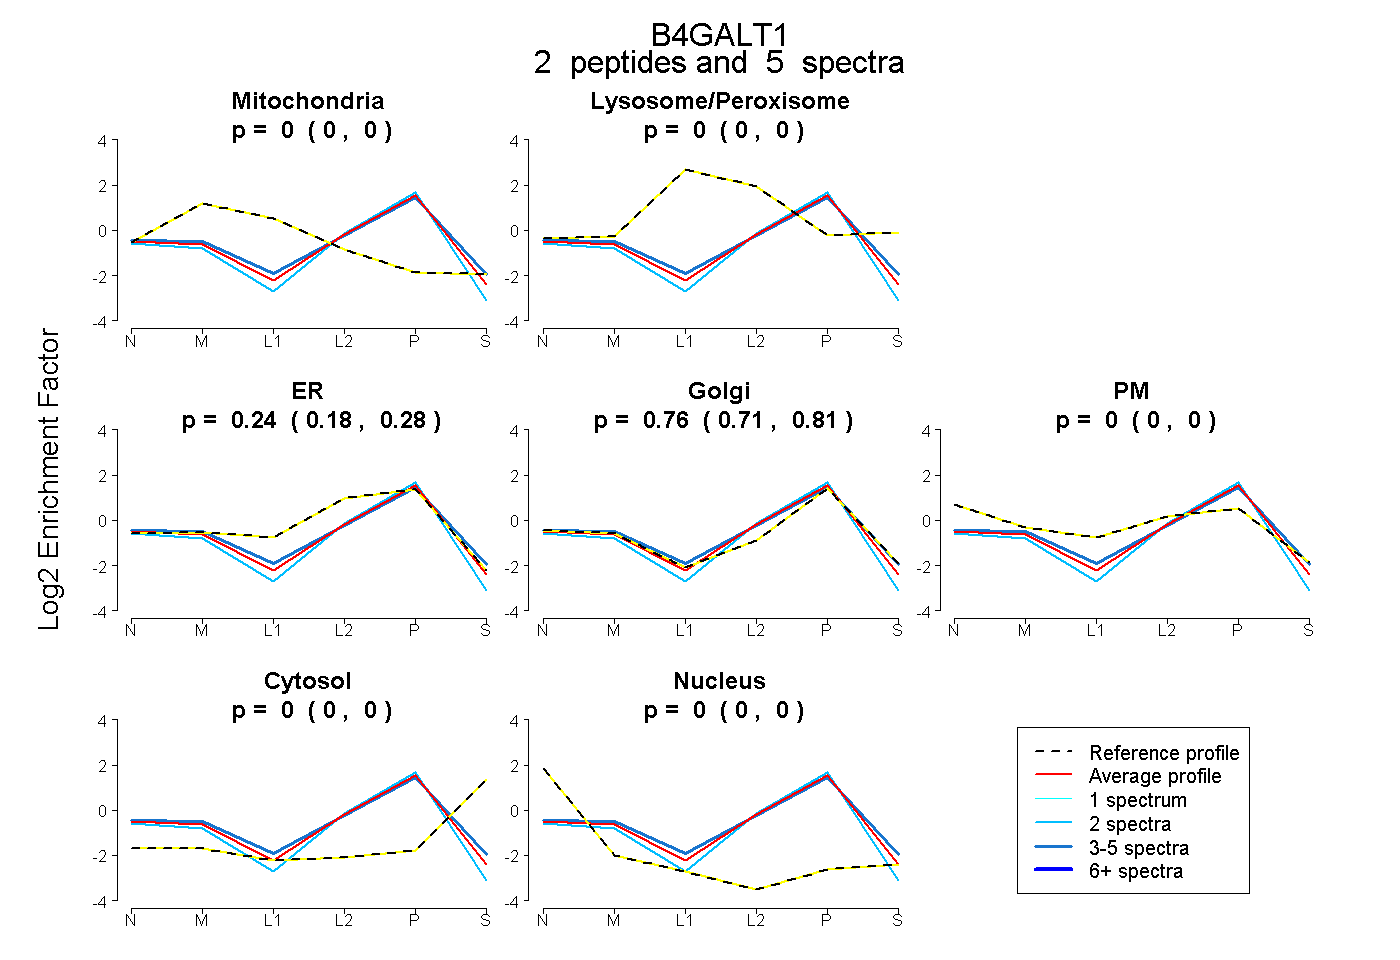 |
0.000 0.000 | 0.000 |
0.000 0.000 | 0.000 |
0.236 0.184 | 0.279 |
0.764 0.712 | 0.808 |
0.000 0.000 | 0.000 |
0.000 0.000 | 0.000 |
0.000 0.000 | 0.000 |
|||
| Plot | Lyso | Other | |||||||||||
| Expt C |
7 peptides |
31 spectra |
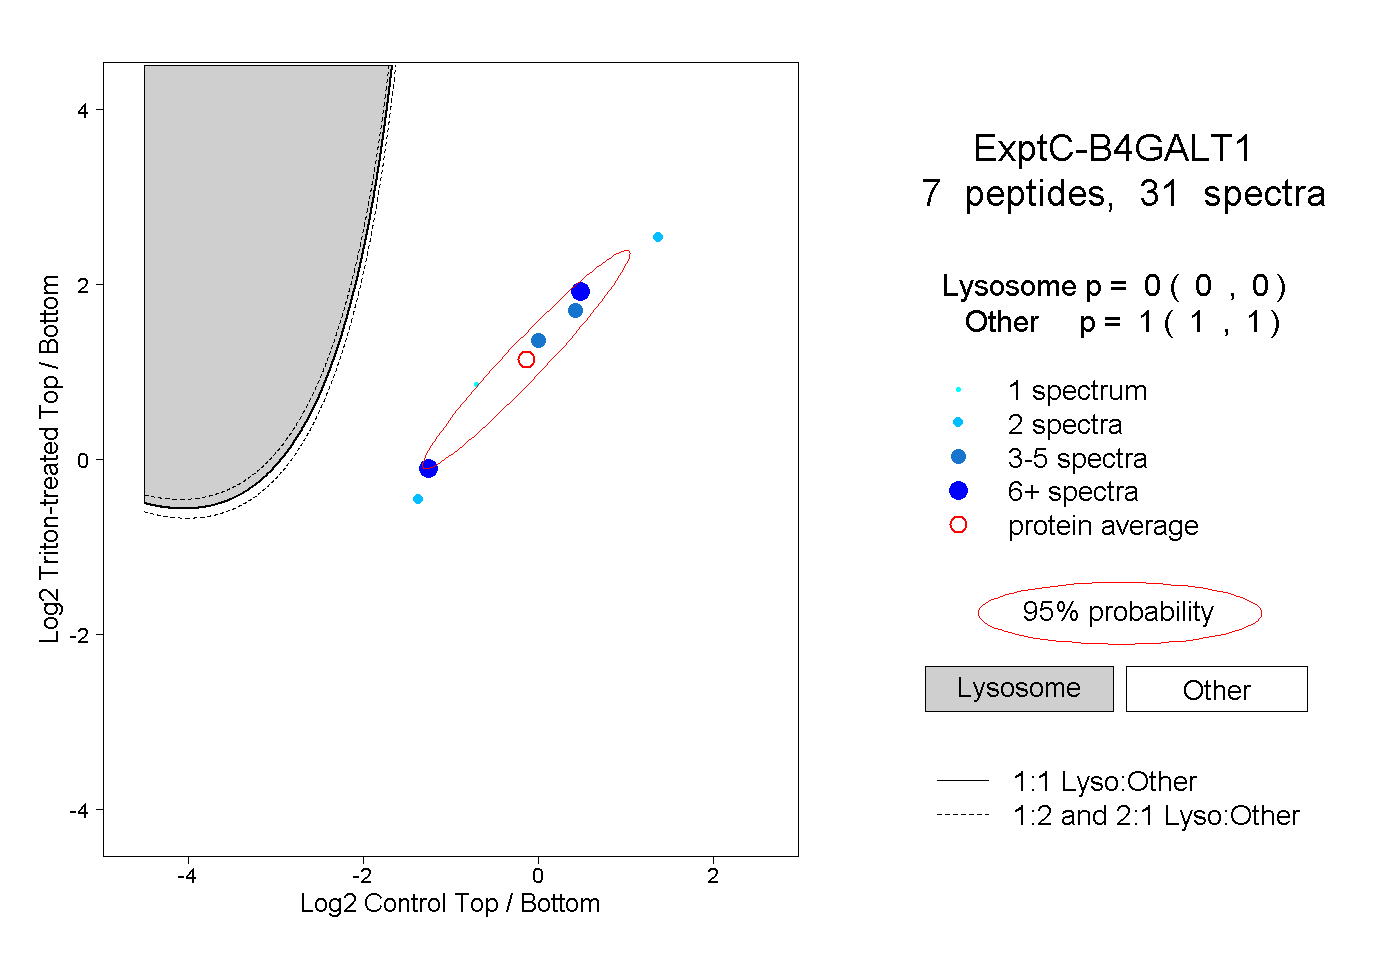 |
0.000 0.000 | 0.000 |
1.000 1.000 | 1.000 |