 11
11peptides
spectra
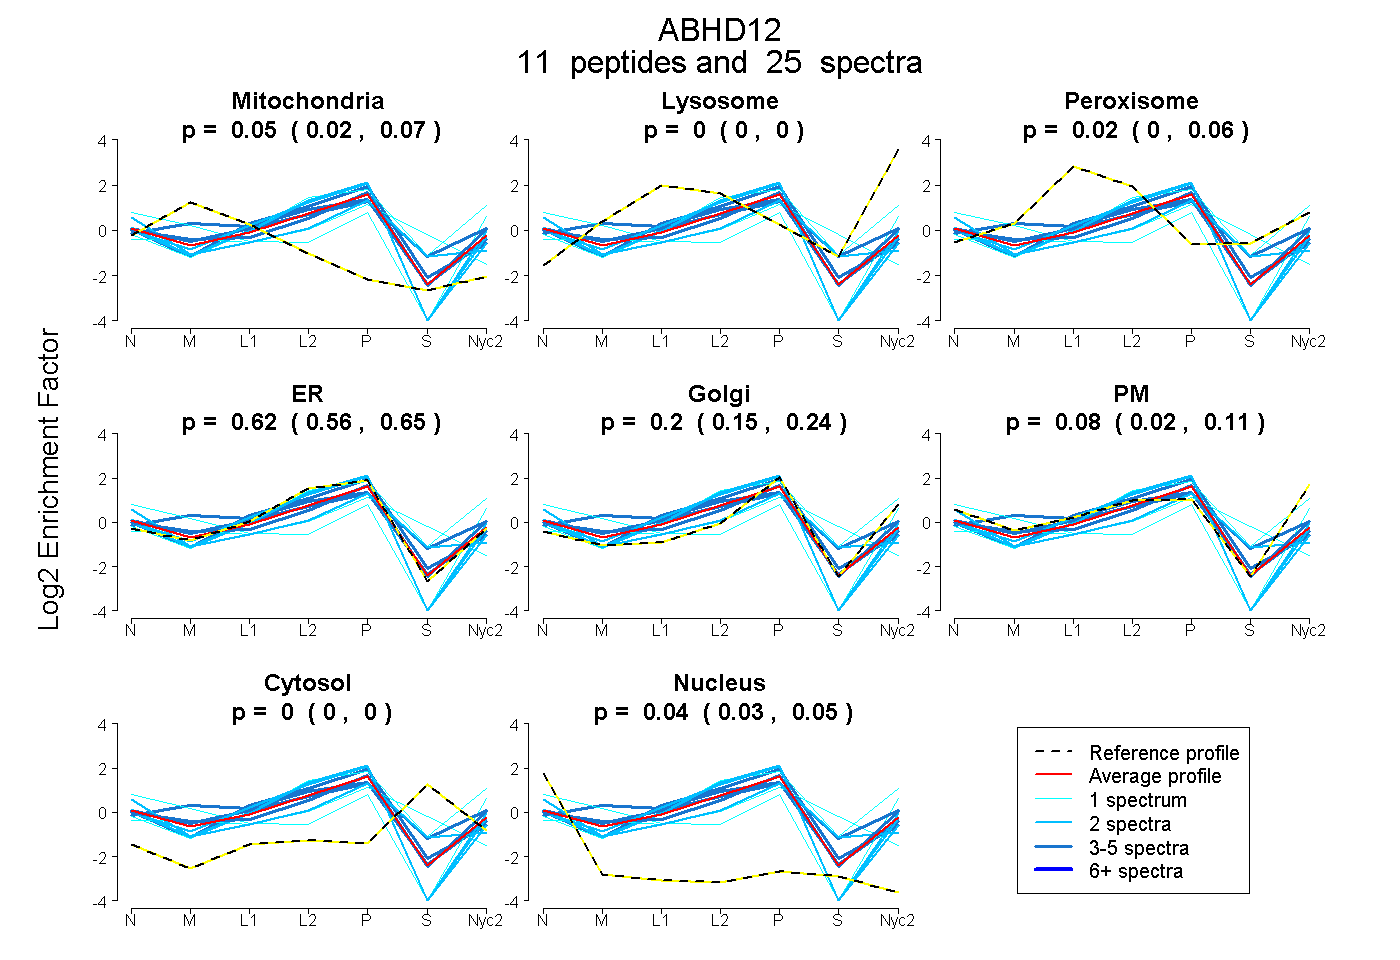
0.022 | 0.070
0.000 | 0.000
0.000 | 0.059
0.564 | 0.653
0.149 | 0.243
0.022 | 0.110
0.000 | 0.000
0.030 | 0.055
6peptides
spectra
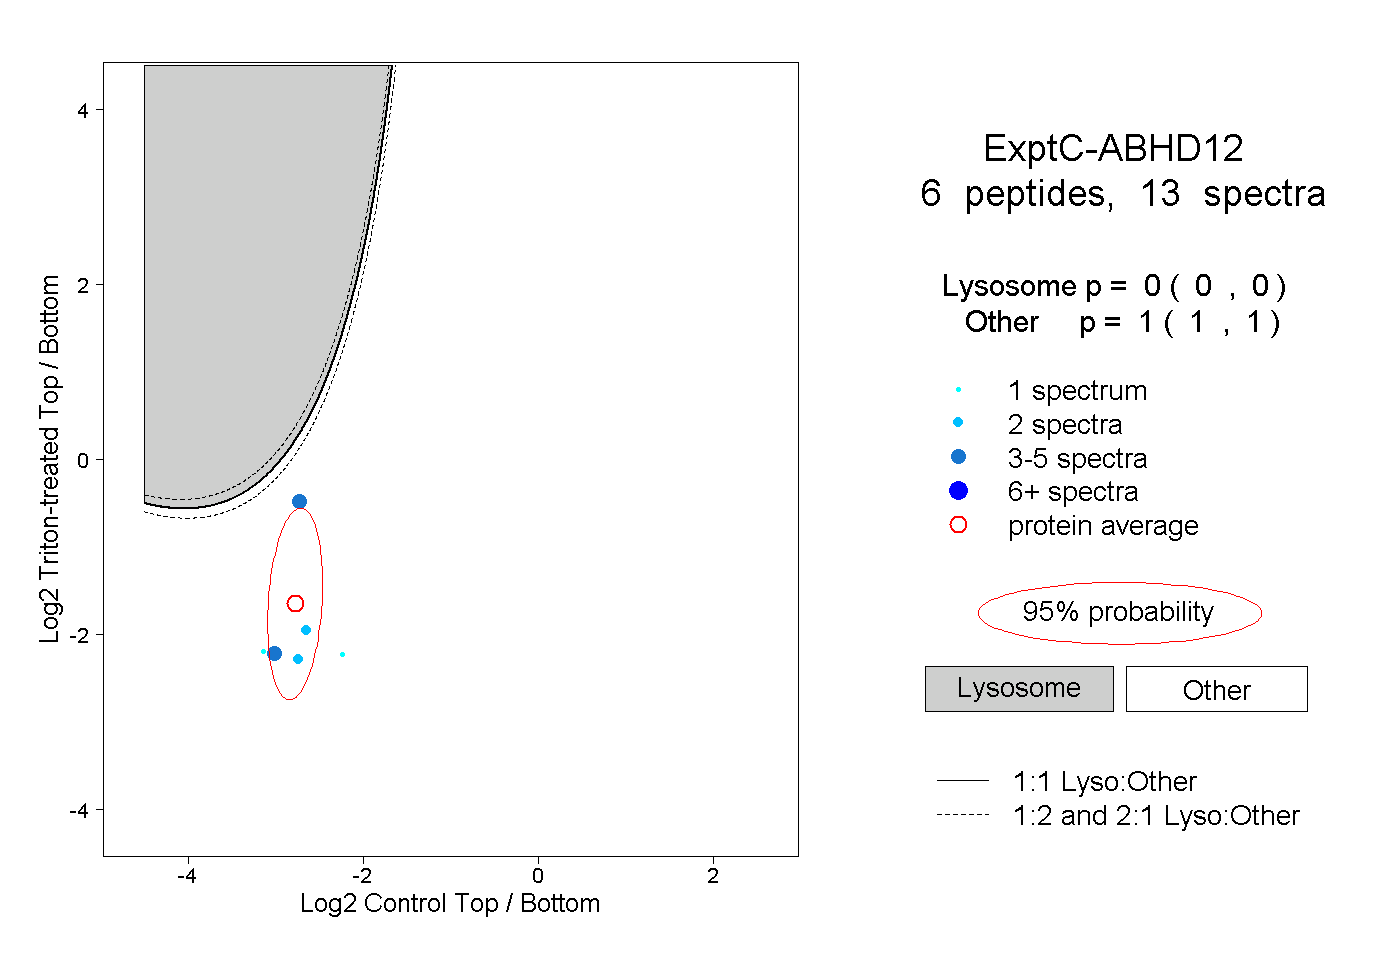
0.000 | 0.000
1.000 | 1.000
3peptides
spectra
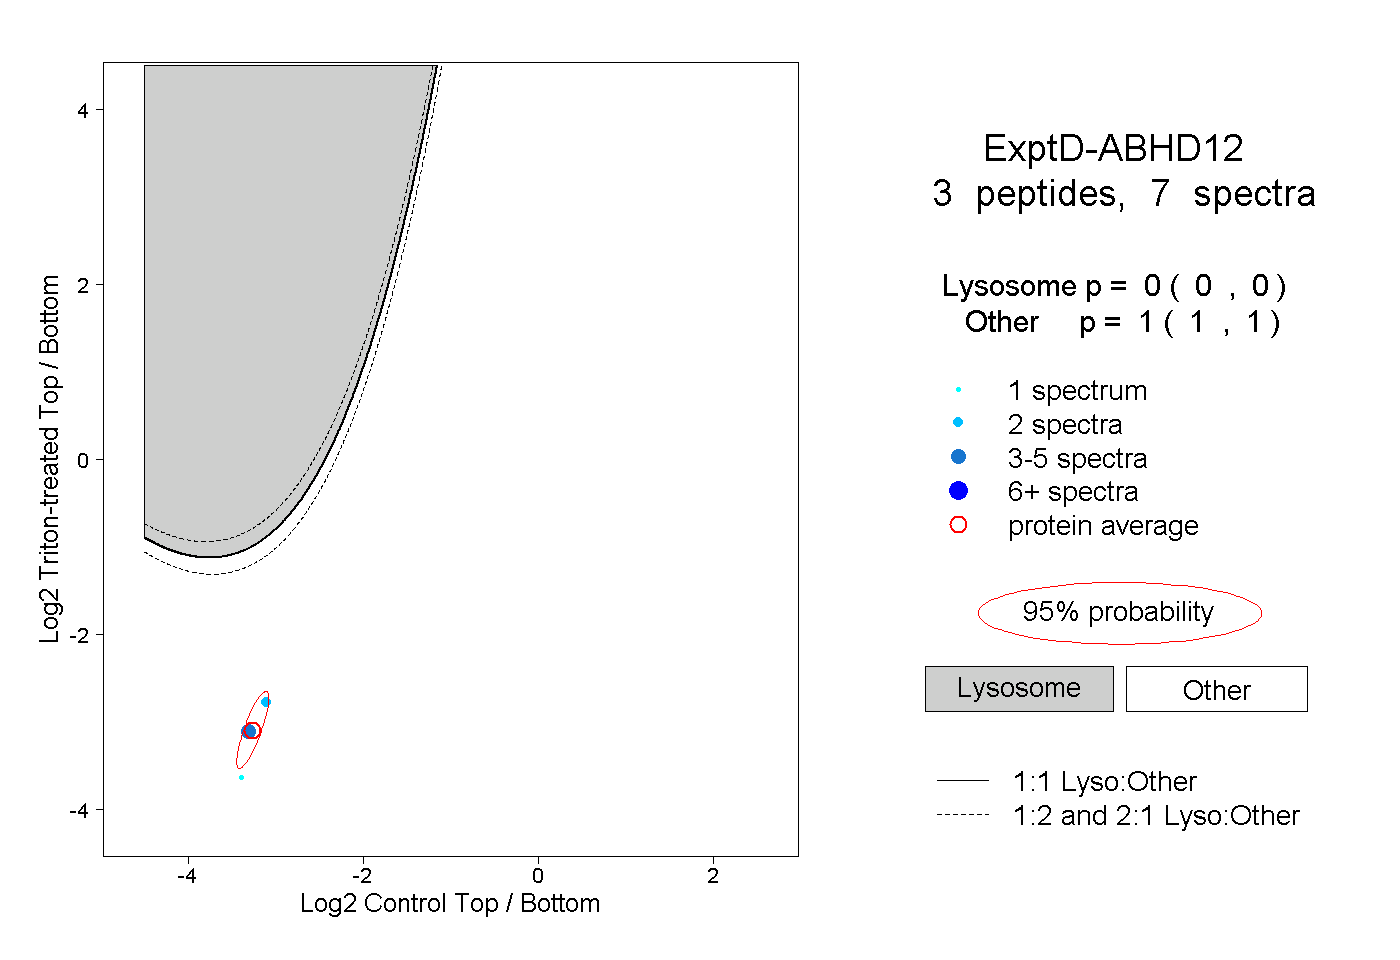
0.000 | 0.000
1.000 | 1.000