 11
11peptides
spectra
0.022 | 0.070
0.000 | 0.000
0.000 | 0.059
0.564 | 0.653
0.149 | 0.243
0.022 | 0.110
0.000 | 0.000
0.030 | 0.055
| Plot | Mito | Lyso | Perox | ER | Golgi | PM | Cytosol | Nucleus | |||||
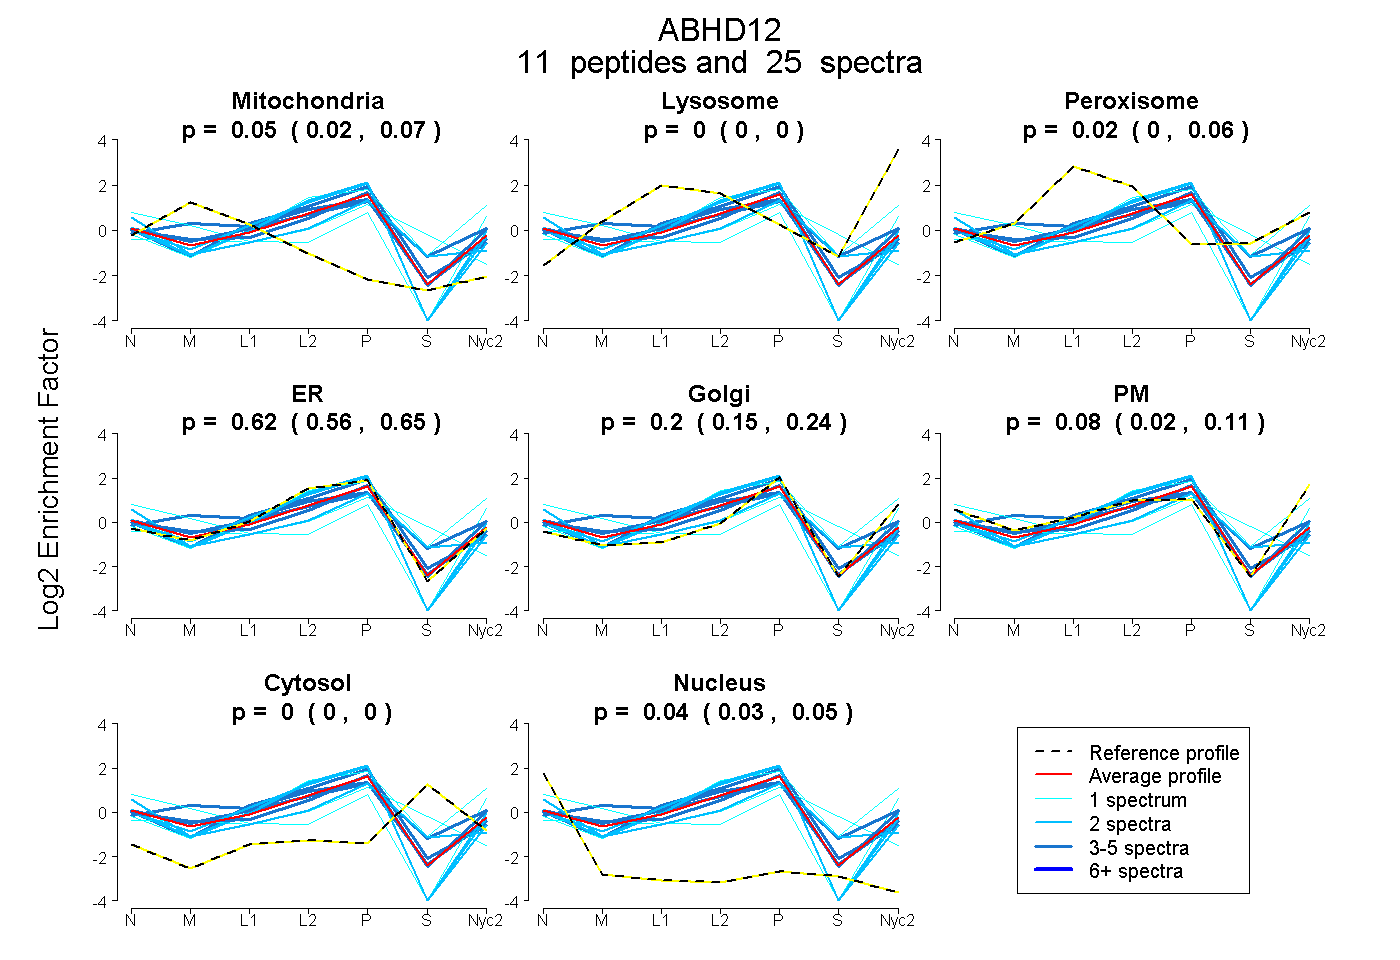
| Expt A |
11 peptides |
25 spectra |
|
0.052 0.022 | 0.070 |
0.000 0.000 | 0.000 |
0.019 0.000 | 0.059 |
0.616 0.564 | 0.653 |
0.196 0.149 | 0.243 |
0.076 0.022 | 0.110 |
0.000 0.000 | 0.000 |
0.042 0.030 | 0.055 |
| 2 spectra, VPYFIDLK | 0.000 | 0.000 | 0.000 | 0.979 | 0.000 | 0.005 | 0.000 | 0.016 | ||
| 5 spectra, SHPFSVIYR | 0.000 | 0.000 | 0.152 | 0.381 | 0.165 | 0.148 | 0.153 | 0.000 | ||
| 1 spectrum, LCPGIQAK | 0.109 | 0.000 | 0.000 | 0.515 | 0.000 | 0.000 | 0.376 | 0.000 | ||
| 1 spectrum, SGDNPVYIWGHSLGTGVATNLVR | 0.173 | 0.000 | 0.000 | 0.000 | 0.237 | 0.506 | 0.000 | 0.083 | ||
| 1 spectrum, LYNIAAPSR | 0.000 | 0.185 | 0.000 | 0.428 | 0.157 | 0.123 | 0.106 | 0.000 | ||
| 3 spectra, GTAEPHSASDAGMK | 0.000 | 0.000 | 0.021 | 0.893 | 0.000 | 0.000 | 0.068 | 0.019 | ||
| 2 spectra, SPELPR | 0.000 | 0.000 | 0.000 | 0.953 | 0.000 | 0.000 | 0.000 | 0.047 | ||
| 3 spectra, FANDENMK | 0.199 | 0.035 | 0.006 | 0.694 | 0.000 | 0.066 | 0.000 | 0.000 | ||
| 2 spectra, GWGDSVGTPSER | 0.000 | 0.000 | 0.000 | 0.915 | 0.059 | 0.017 | 0.000 | 0.009 | ||
| 2 spectra, TEPVTLEHER | 0.000 | 0.000 | 0.000 | 0.564 | 0.075 | 0.047 | 0.205 | 0.108 | ||
| 3 spectra, VQFIPFHSDLGYR | 0.104 | 0.000 | 0.000 | 0.411 | 0.403 | 0.082 | 0.000 | 0.000 |
| Plot | Lyso | Other | |||||||||||
| Expt C |
6 peptides |
13 spectra |
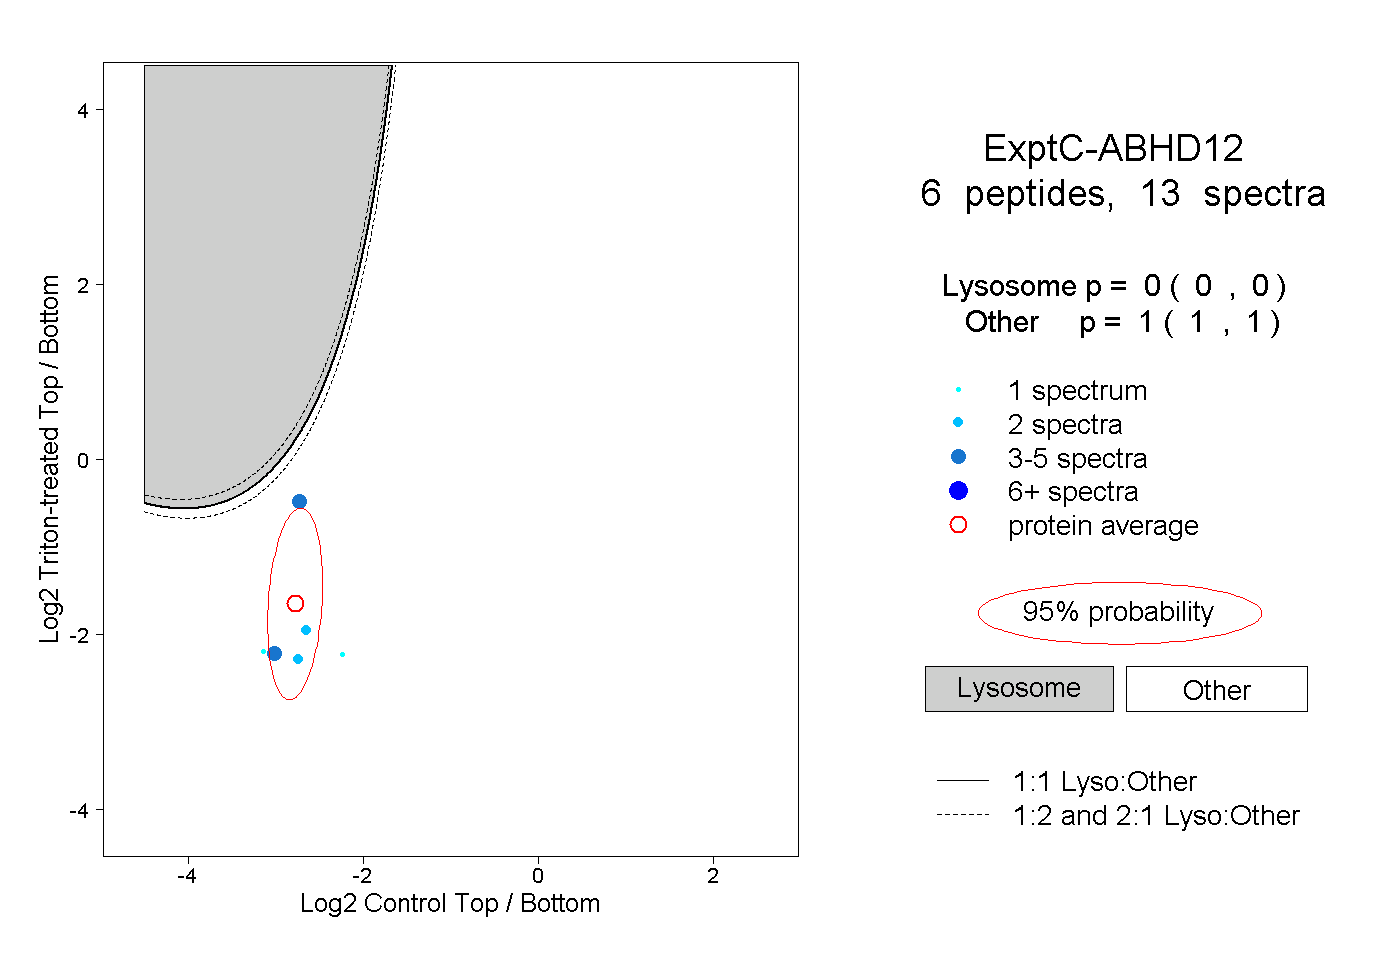 |
0.000 0.000 | 0.000 |
1.000 1.000 | 1.000 |
||||||||
| Plot | Lyso | Other | |||||||||||
| Expt D |
3 peptides |
7 spectra |
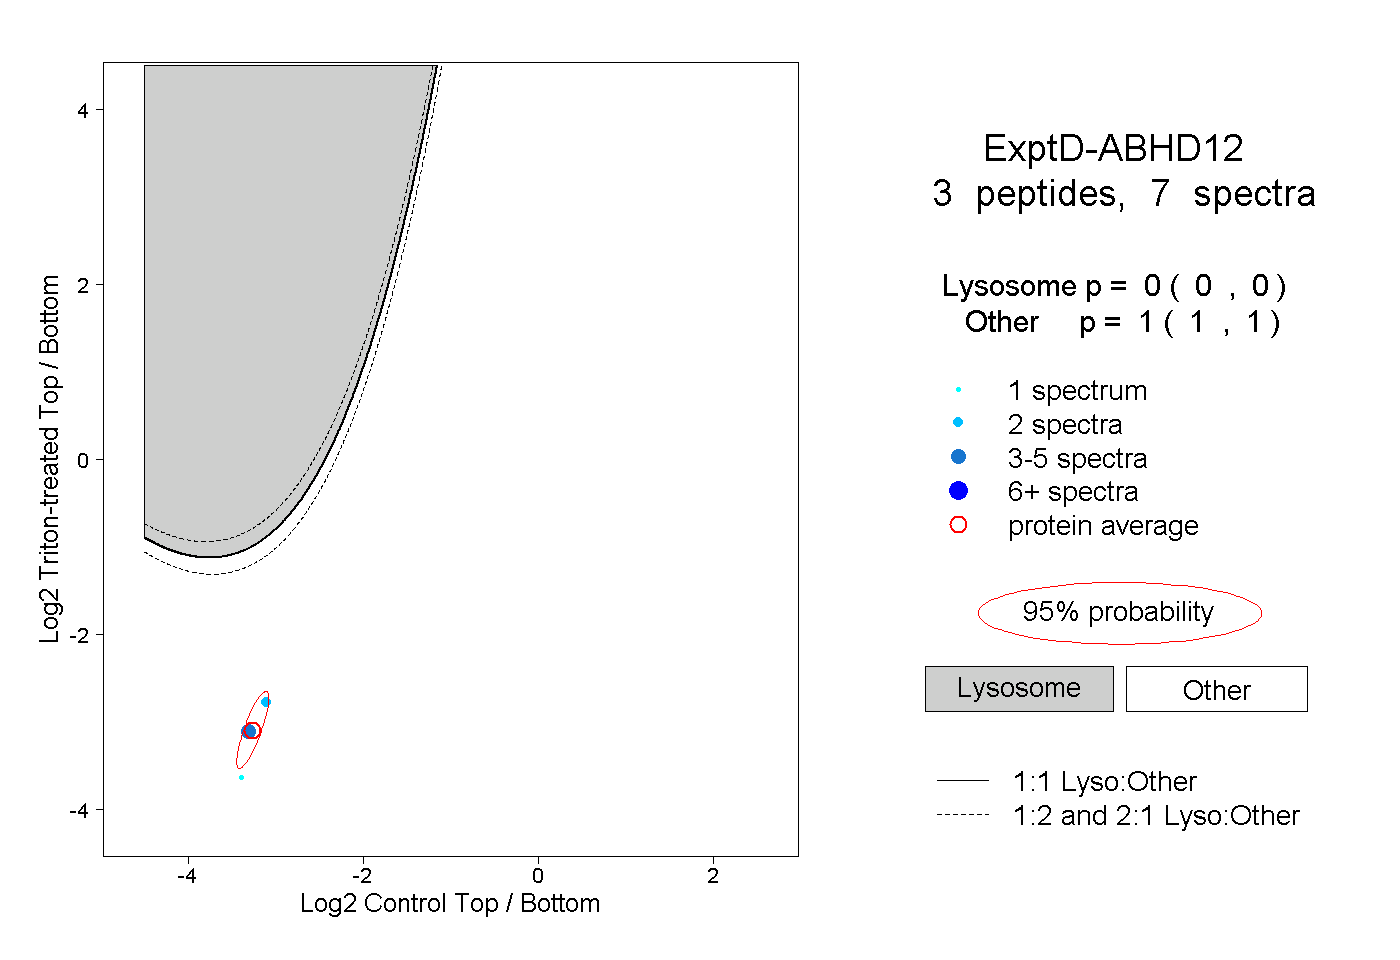 |
0.000 0.000 | 0.000 |
1.000 1.000 | 1.000 |