 6
6peptides
spectra
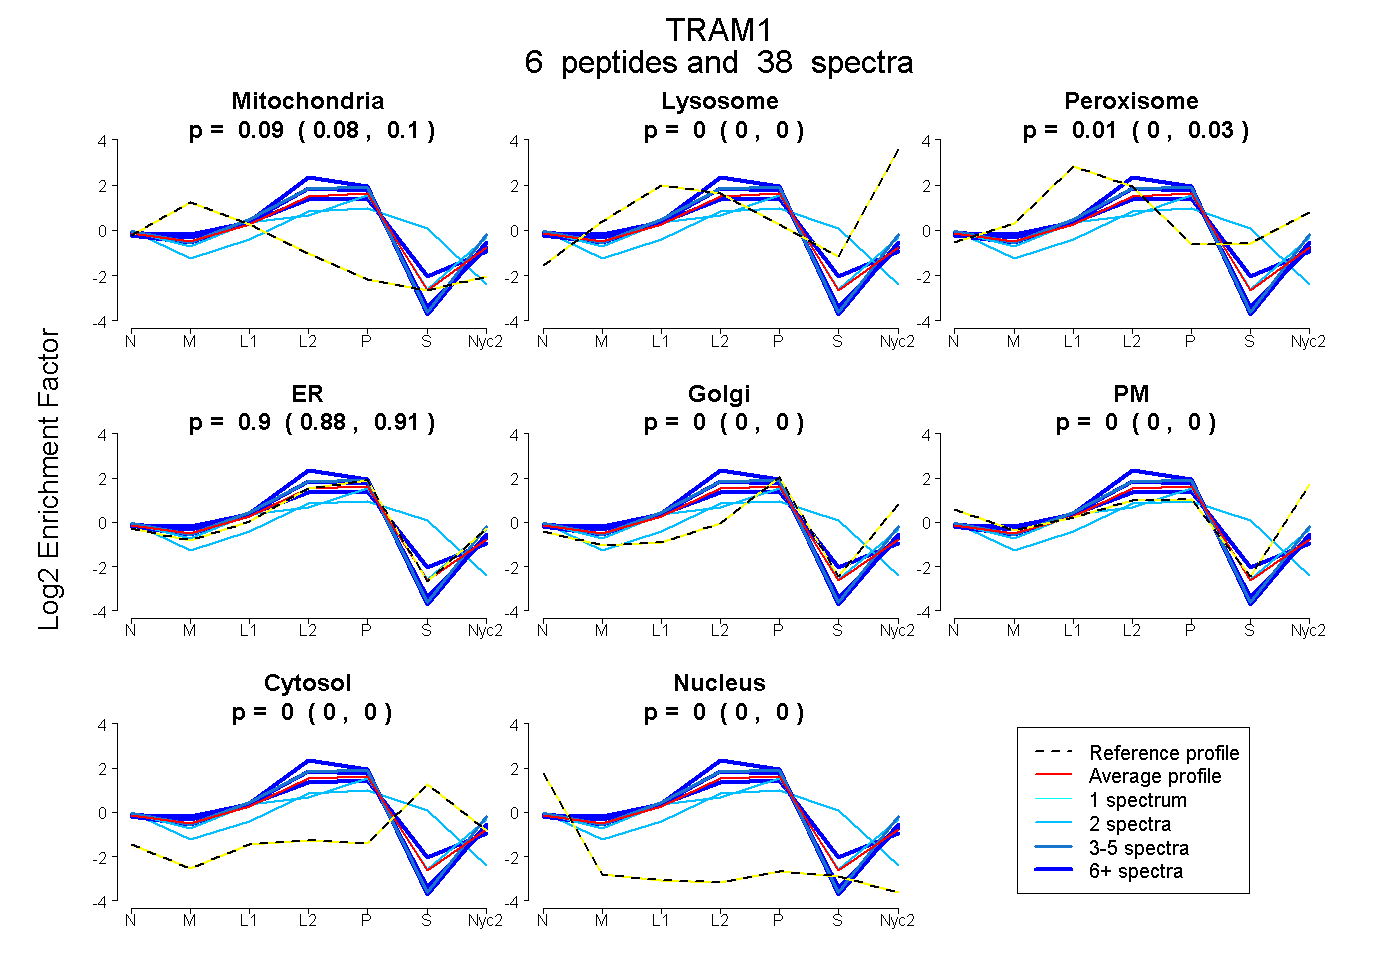
0.077 | 0.100
0.000 | 0.000
0.000 | 0.029
0.884 | 0.912
0.000 | 0.000
0.000 | 0.000
0.000 | 0.000
0.000 | 0.000
3peptides
spectra
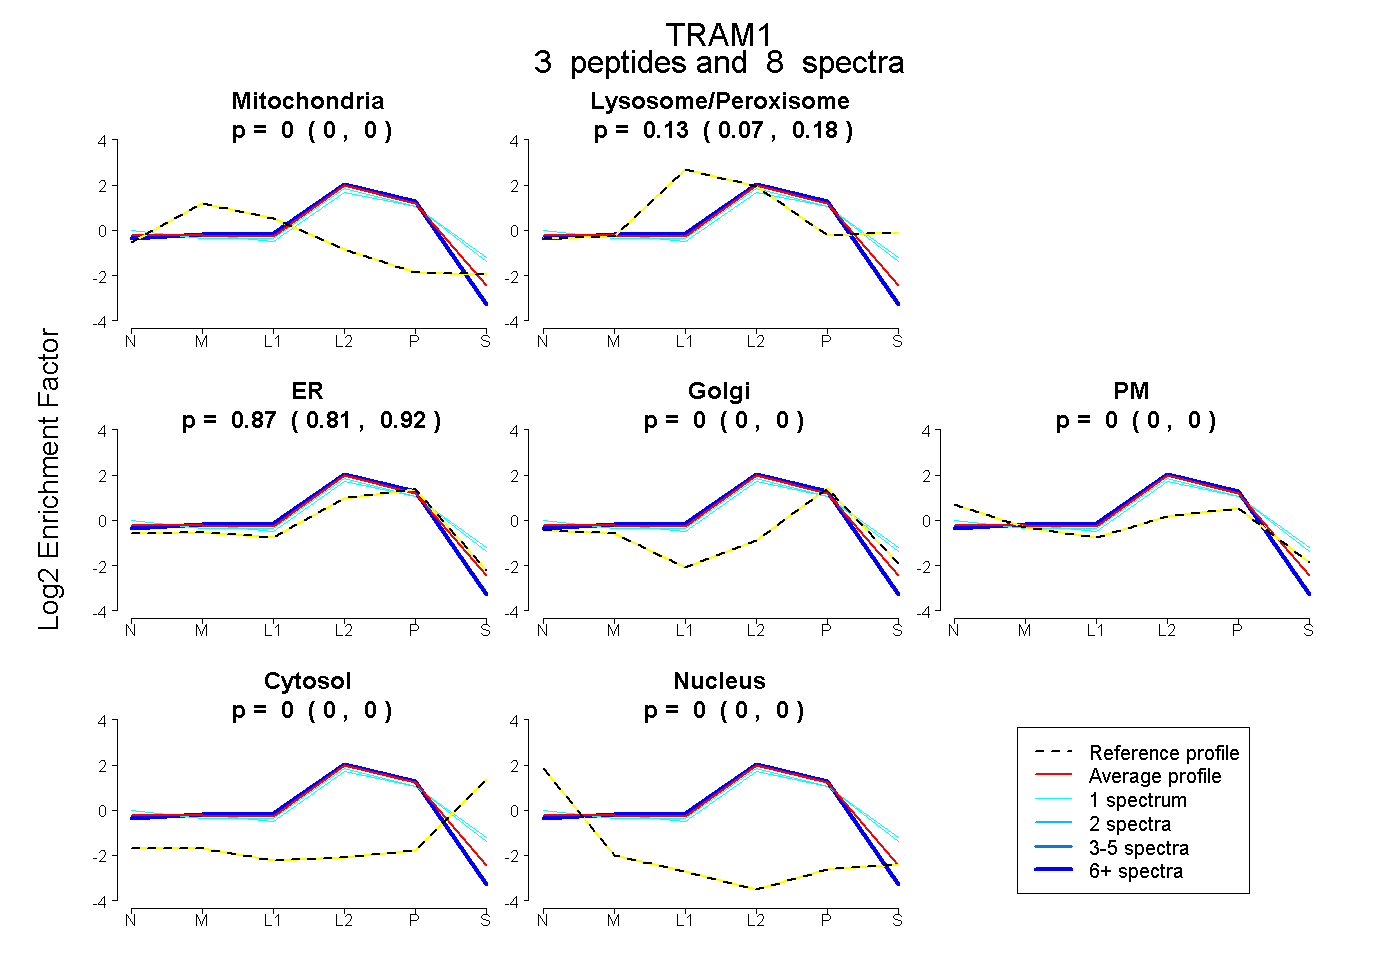
0.000 | 0.000
0.068 | 0.178
0.808 | 0.921
0.000 | 0.000
0.000 | 0.000
0.000 | 0.000
0.000 | 0.000
6peptides
spectra
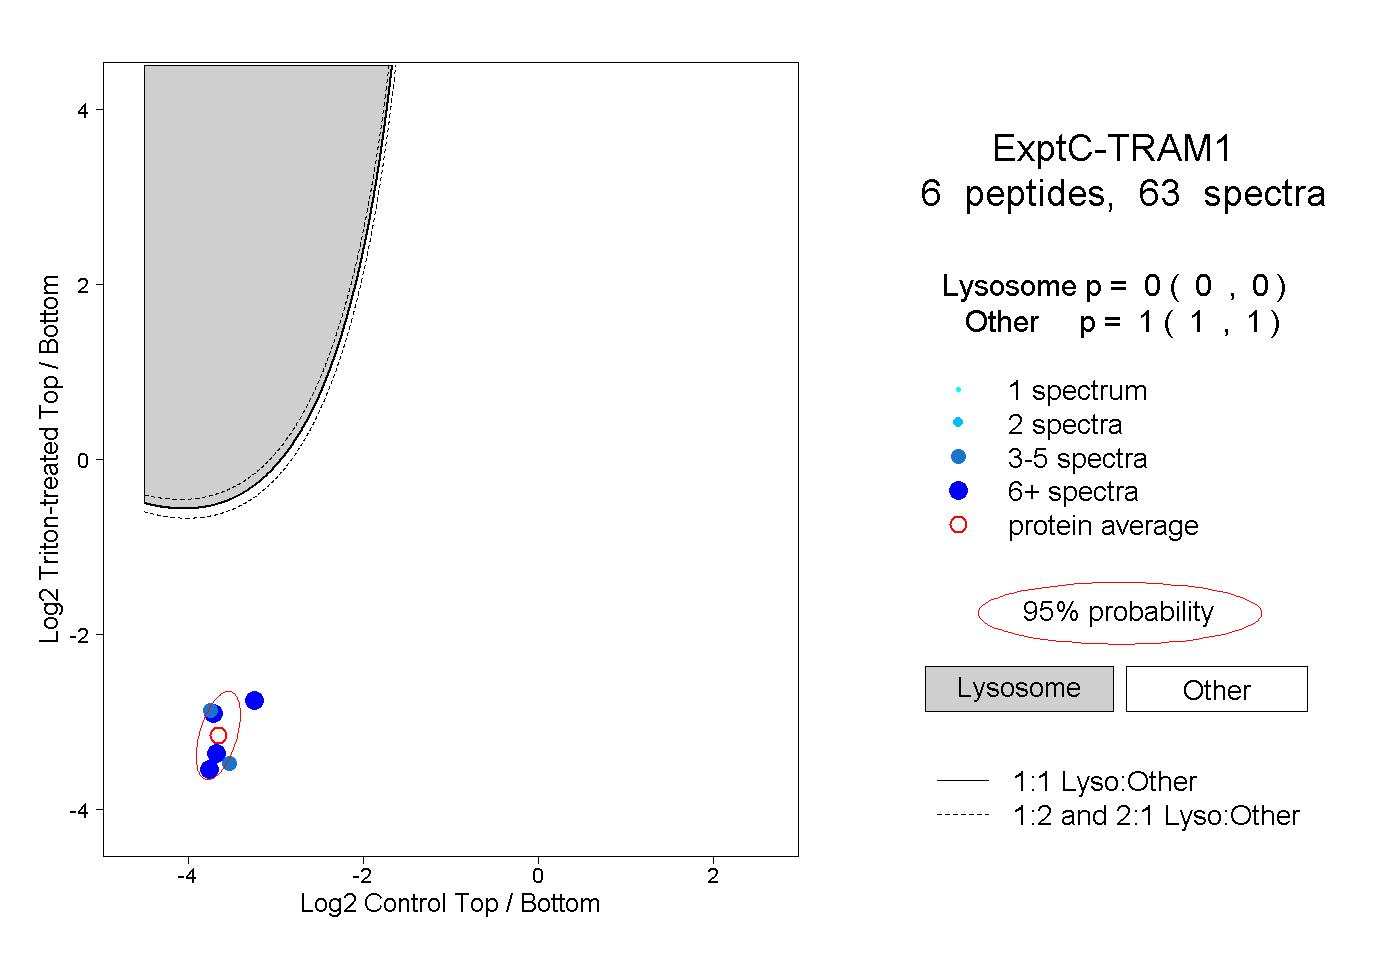
0.000 | 0.000
1.000 | 1.000
1peptide
spectrum
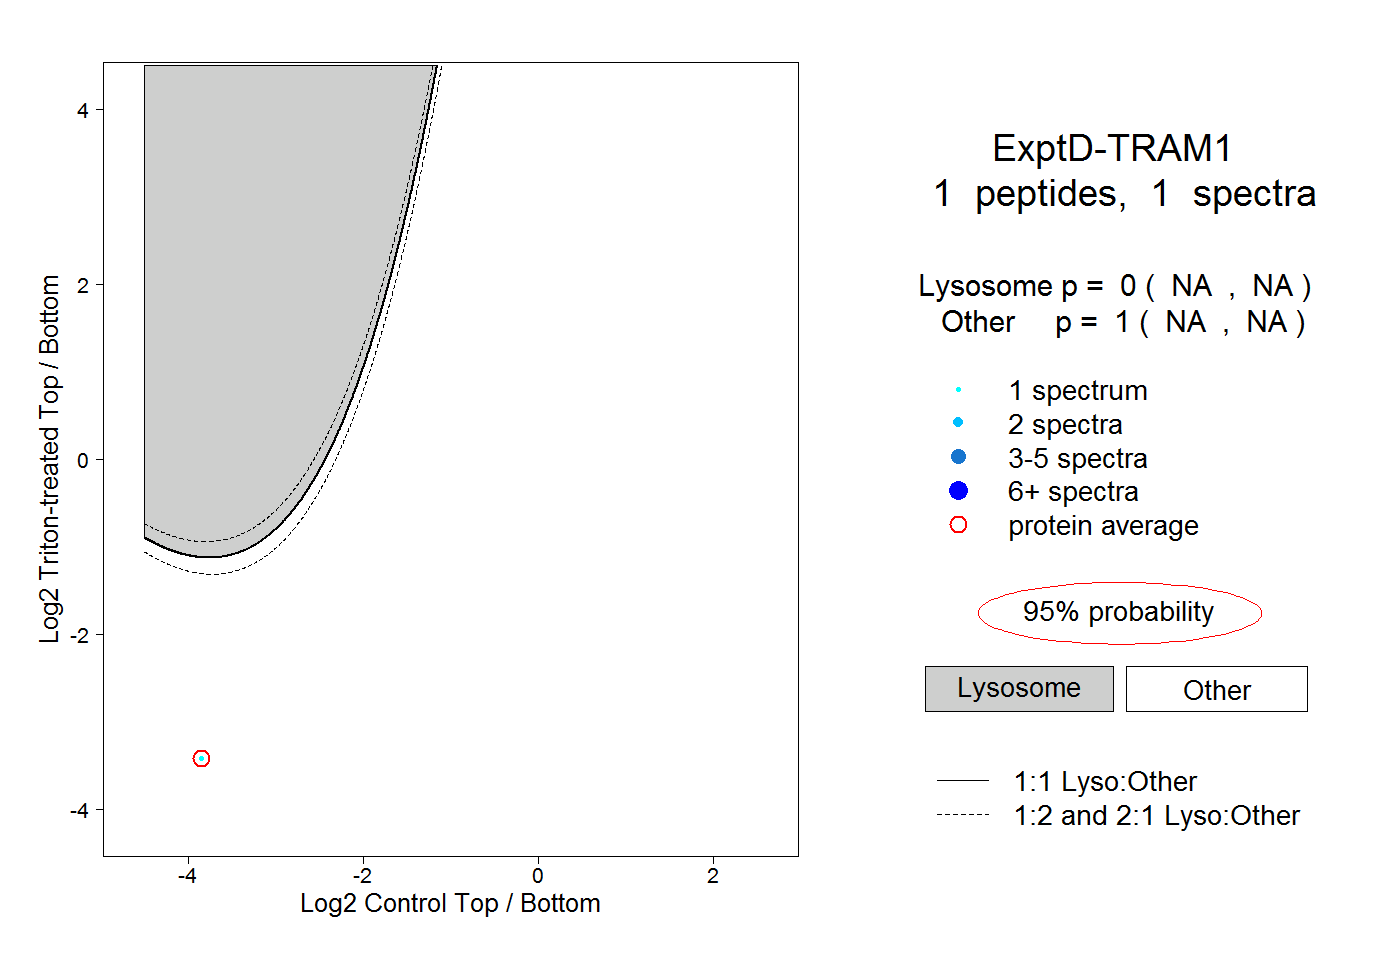
NA | NA
NA | NA