 6
6peptides
spectra
0.077 | 0.100
0.000 | 0.000
0.000 | 0.029
0.884 | 0.912
0.000 | 0.000
0.000 | 0.000
0.000 | 0.000
0.000 | 0.000
| Plot | Mito | Lyso | Perox | ER | Golgi | PM | Cytosol | Nucleus | |||||
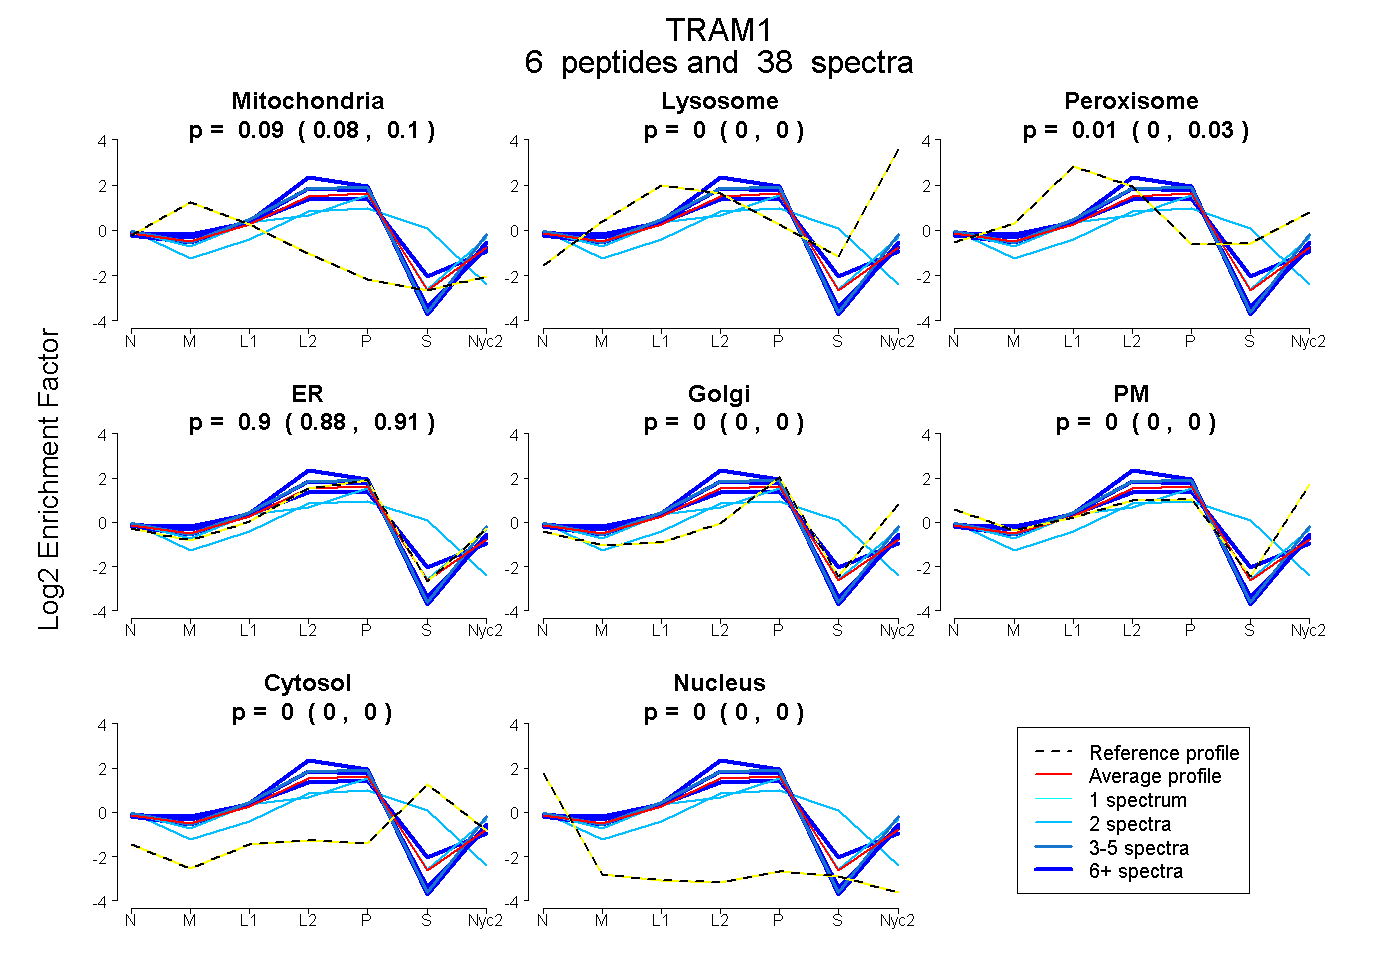
| Expt A |
6 peptides |
38 spectra |
|
0.090 0.077 | 0.100 |
0.000 0.000 | 0.000 |
0.010 0.000 | 0.029 |
0.900 0.884 | 0.912 |
0.000 0.000 | 0.000 |
0.000 0.000 | 0.000 |
0.000 0.000 | 0.000 |
0.000 0.000 | 0.000 |
| 5 spectra, LFYFSDEK | 0.000 | 0.000 | 0.000 | 0.972 | 0.000 | 0.028 | 0.000 | 0.000 | ||
| 8 spectra, FINFQLR | 0.000 | 0.000 | 0.000 | 1.000 | 0.000 | 0.000 | 0.000 | 0.000 | ||
| 6 spectra, LDFSTGNFNVLAVR | 0.059 | 0.000 | 0.000 | 0.941 | 0.000 | 0.000 | 0.000 | 0.000 | ||
| 2 spectra, KPAVTK | 0.076 | 0.000 | 0.059 | 0.650 | 0.169 | 0.015 | 0.000 | 0.031 | ||
| 2 spectra, EHSAFQAPPVK | 0.000 | 0.000 | 0.013 | 0.543 | 0.000 | 0.000 | 0.403 | 0.041 | ||
| 15 spectra, AYPHNLMTFQMK | 0.129 | 0.000 | 0.088 | 0.777 | 0.000 | 0.000 | 0.006 | 0.000 |
| Plot | Mito | Lyso or Perox | ER | Golgi | PM | Cytosol | Nucleus | ||||||
| Expt B |
3 peptides |
8 spectra |
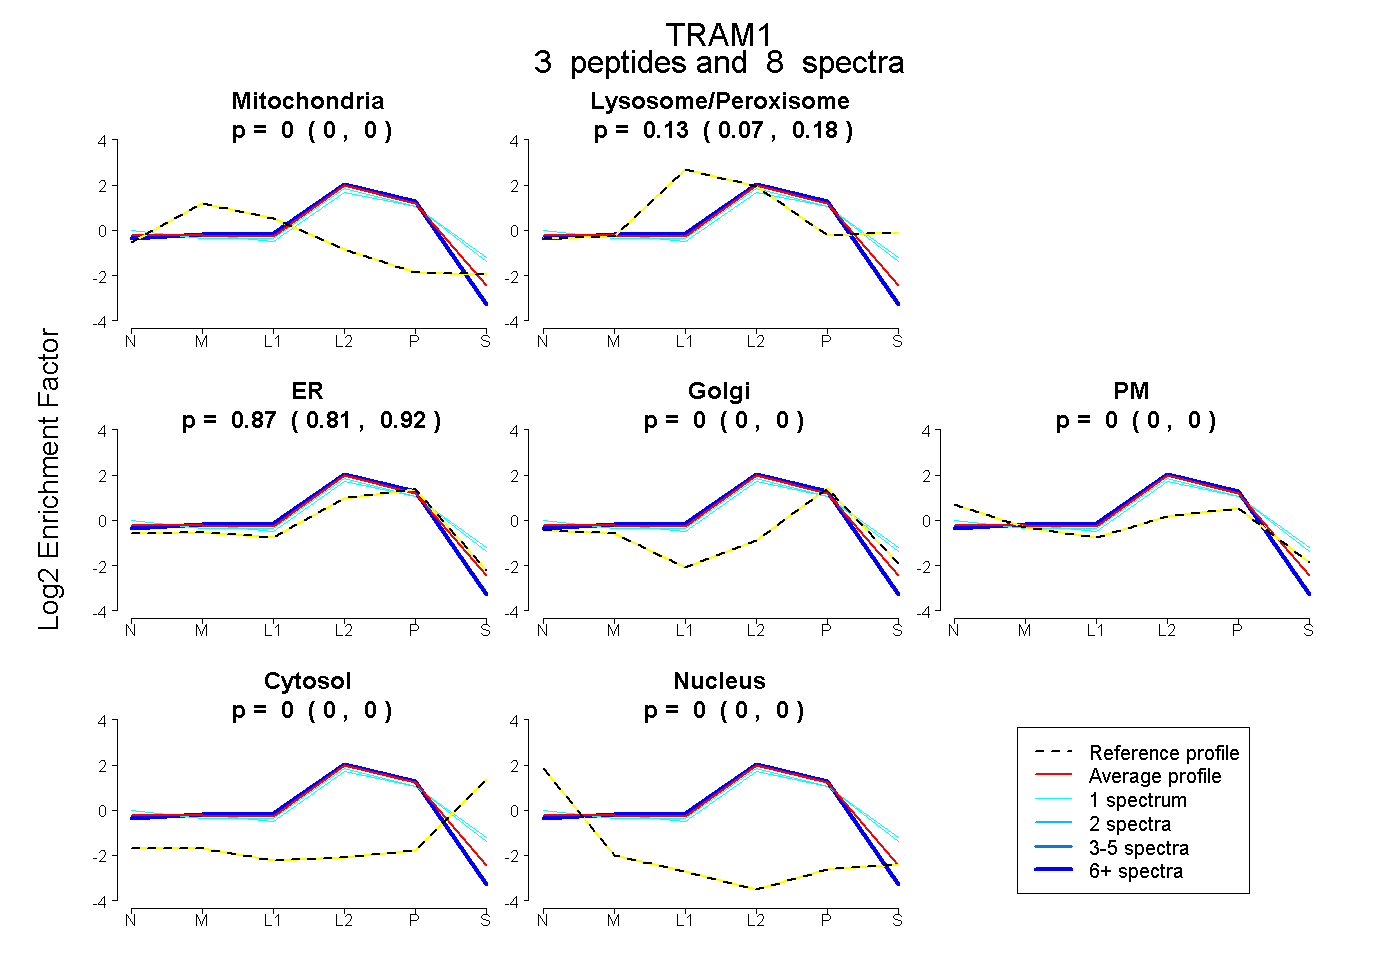 |
0.000 0.000 | 0.000 |
0.128 0.068 | 0.178 |
0.872 0.808 | 0.921 |
0.000 0.000 | 0.000 |
0.000 0.000 | 0.000 |
0.000 0.000 | 0.000 |
0.000 0.000 | 0.000 |
|||
| Plot | Lyso | Other | |||||||||||
| Expt C |
6 peptides |
63 spectra |
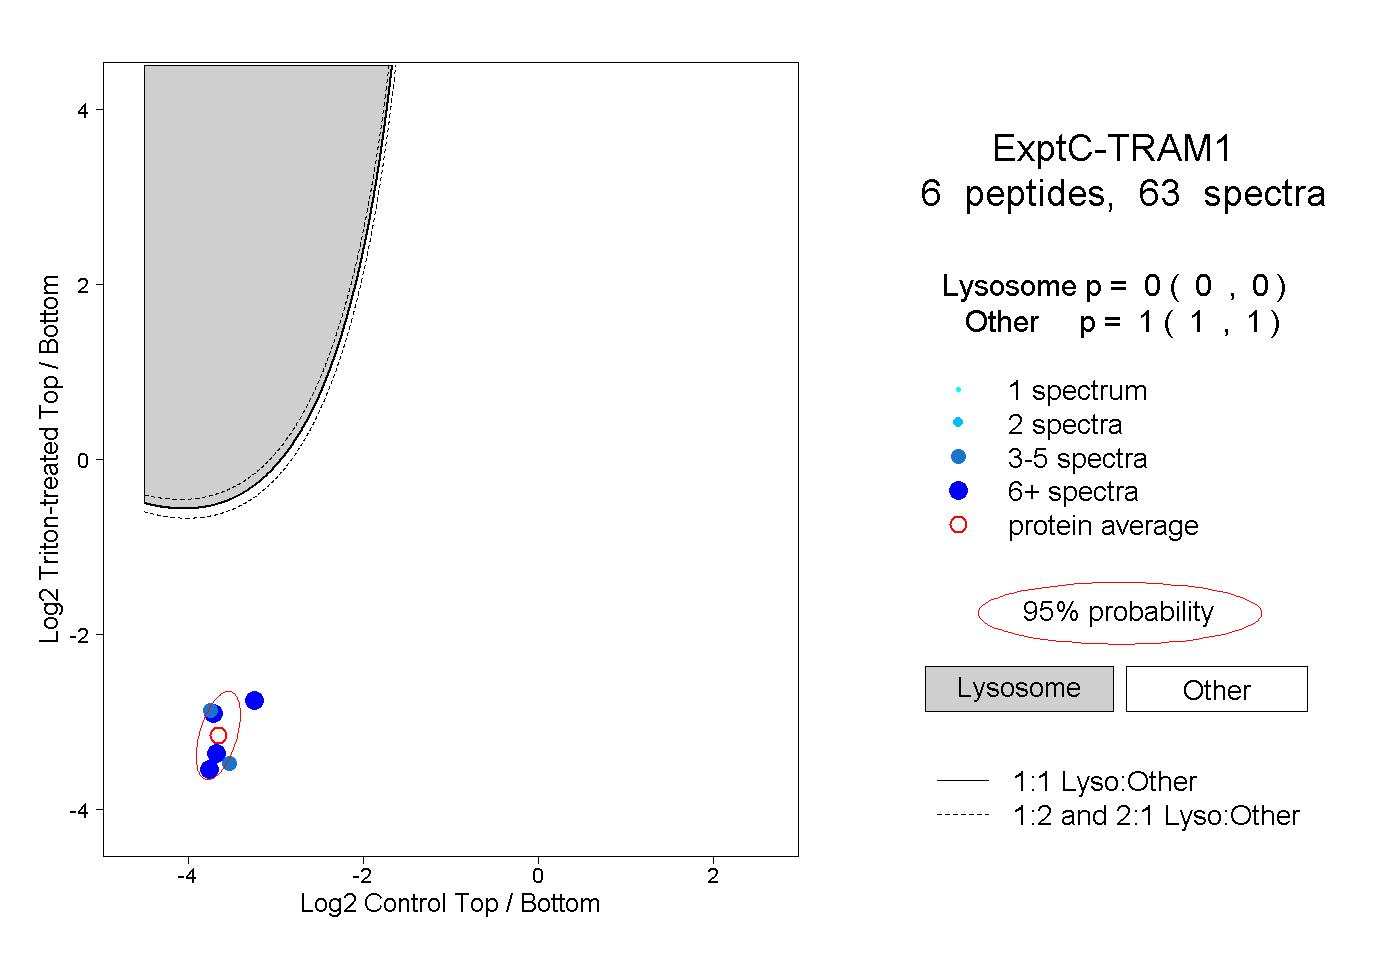 |
0.000 0.000 | 0.000 |
1.000 1.000 | 1.000 |
||||||||
| Plot | Lyso | Other | |||||||||||
| Expt D |
1 peptide |
1 spectrum |
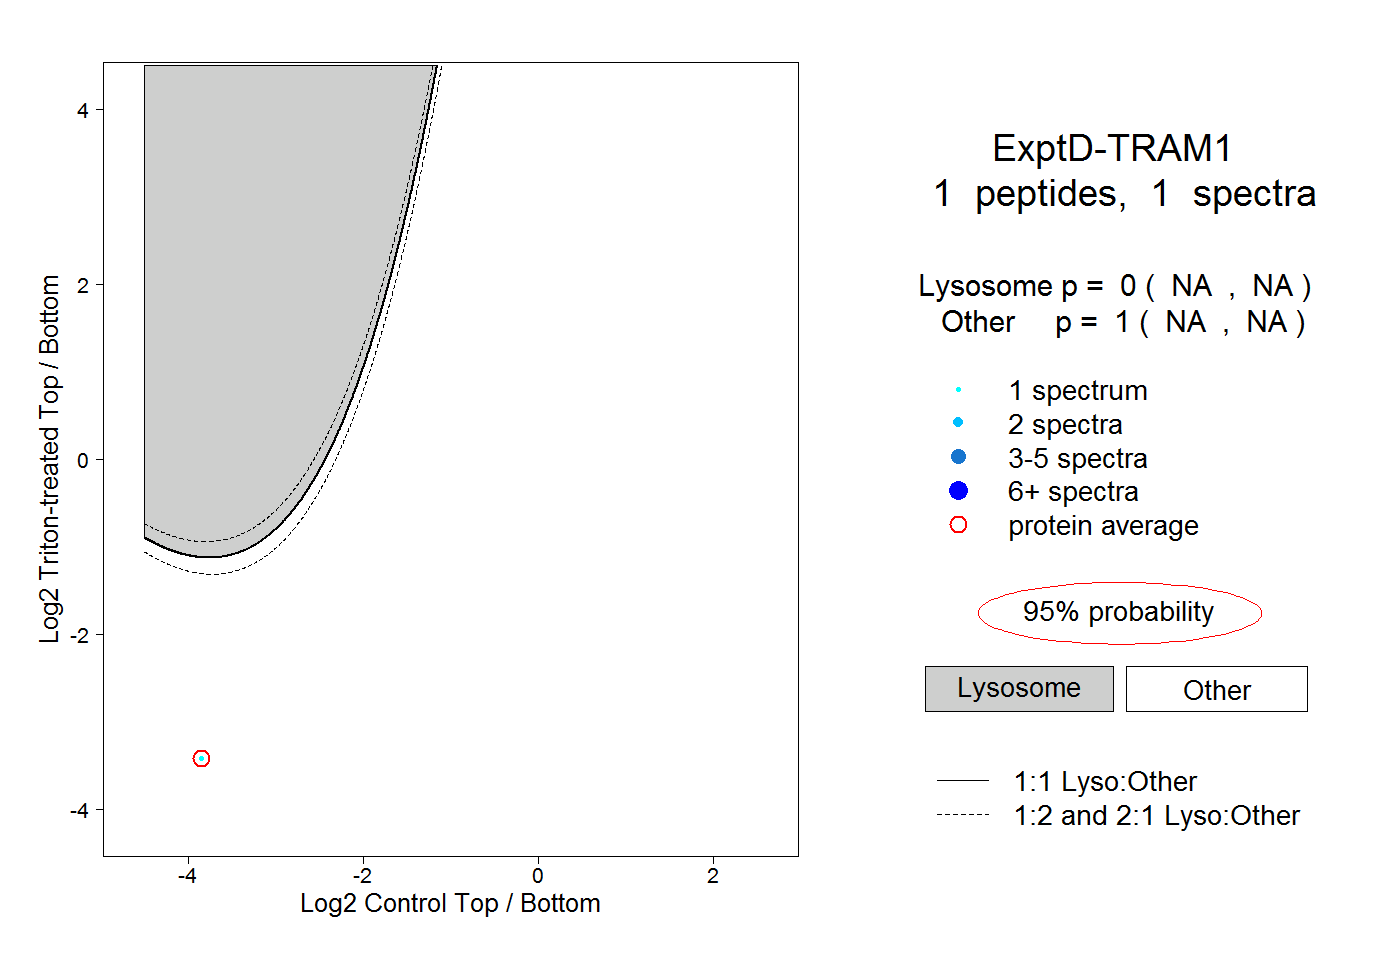 |
0.000 NA | NA |
1.000 NA | NA |