 37
37peptides
spectra
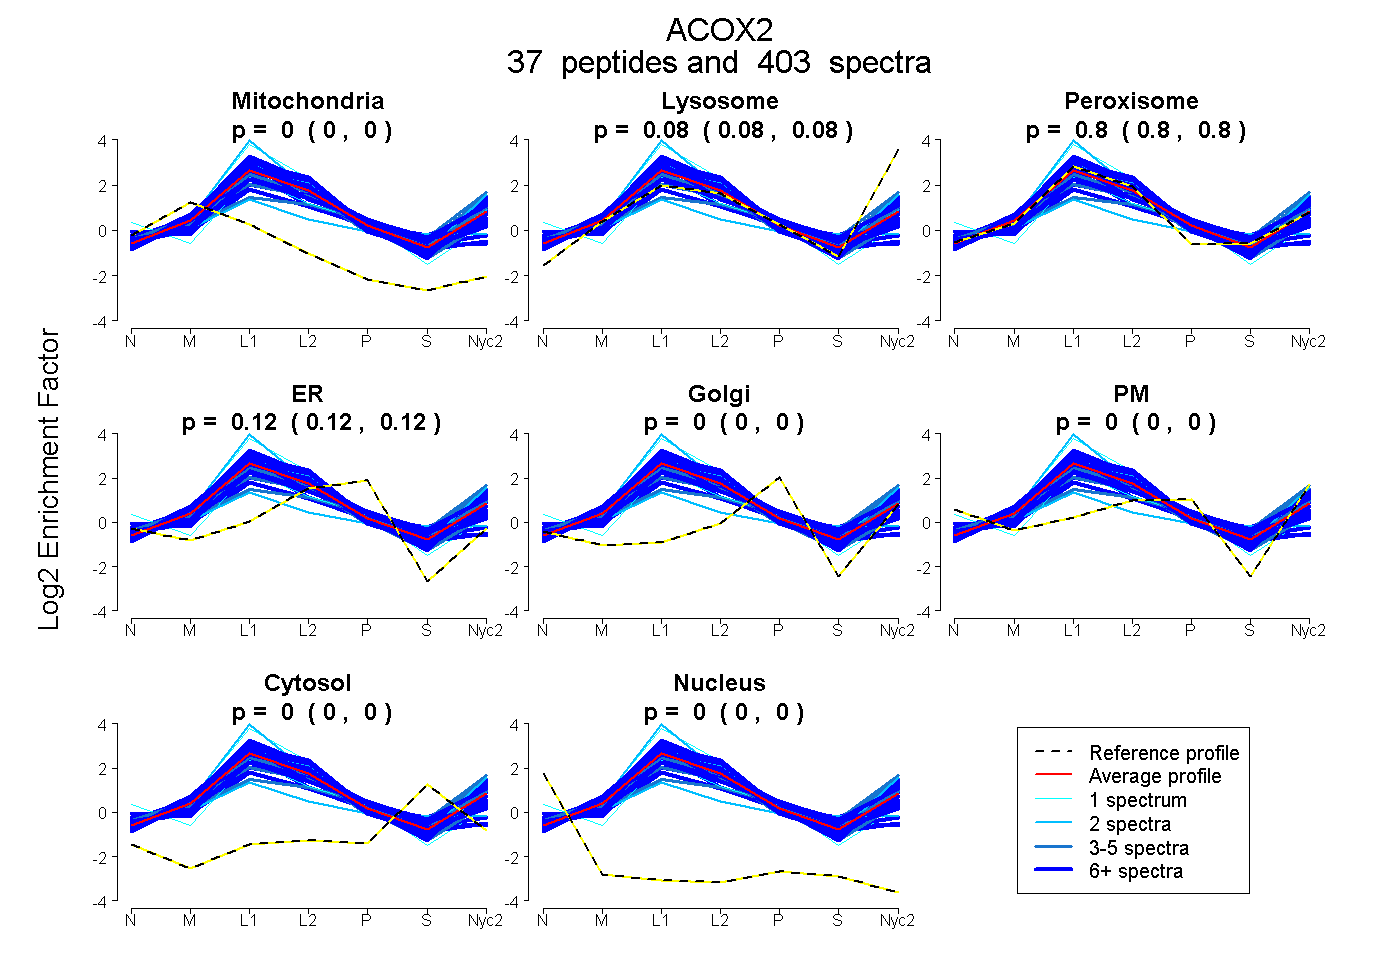
0.000 | 0.000
0.078 | 0.083
0.799 | 0.803
0.117 | 0.119
0.000 | 0.000
0.000 | 0.000
0.000 | 0.000
0.000 | 0.000
34peptides
spectra
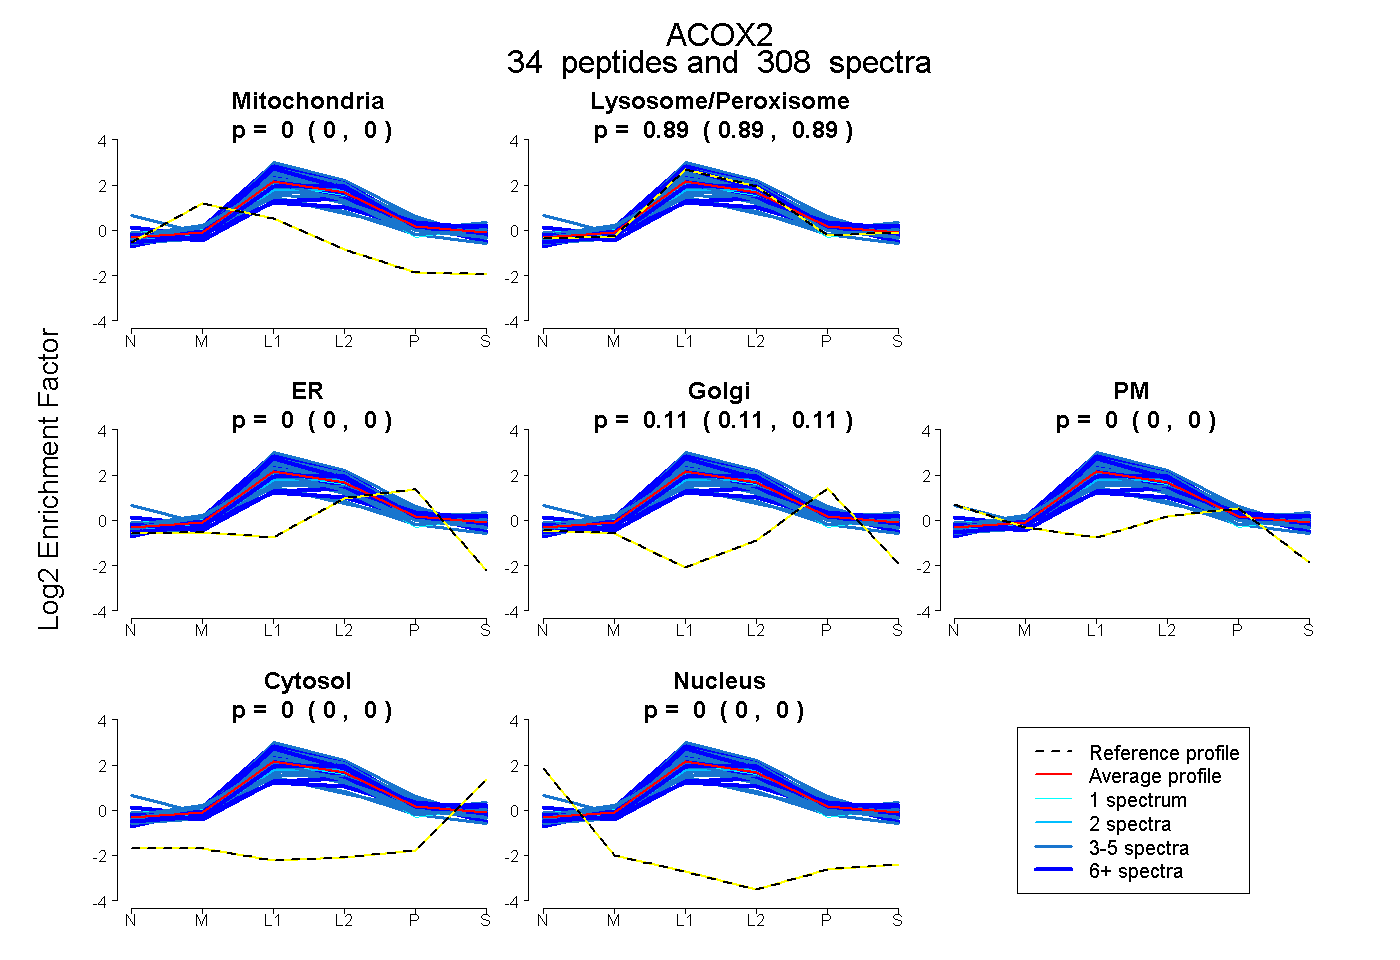
0.000 | 0.000
0.891 | 0.893
0.000 | 0.000
0.106 | 0.109
0.000 | 0.000
0.000 | 0.000
0.000 | 0.000
39peptides
spectra
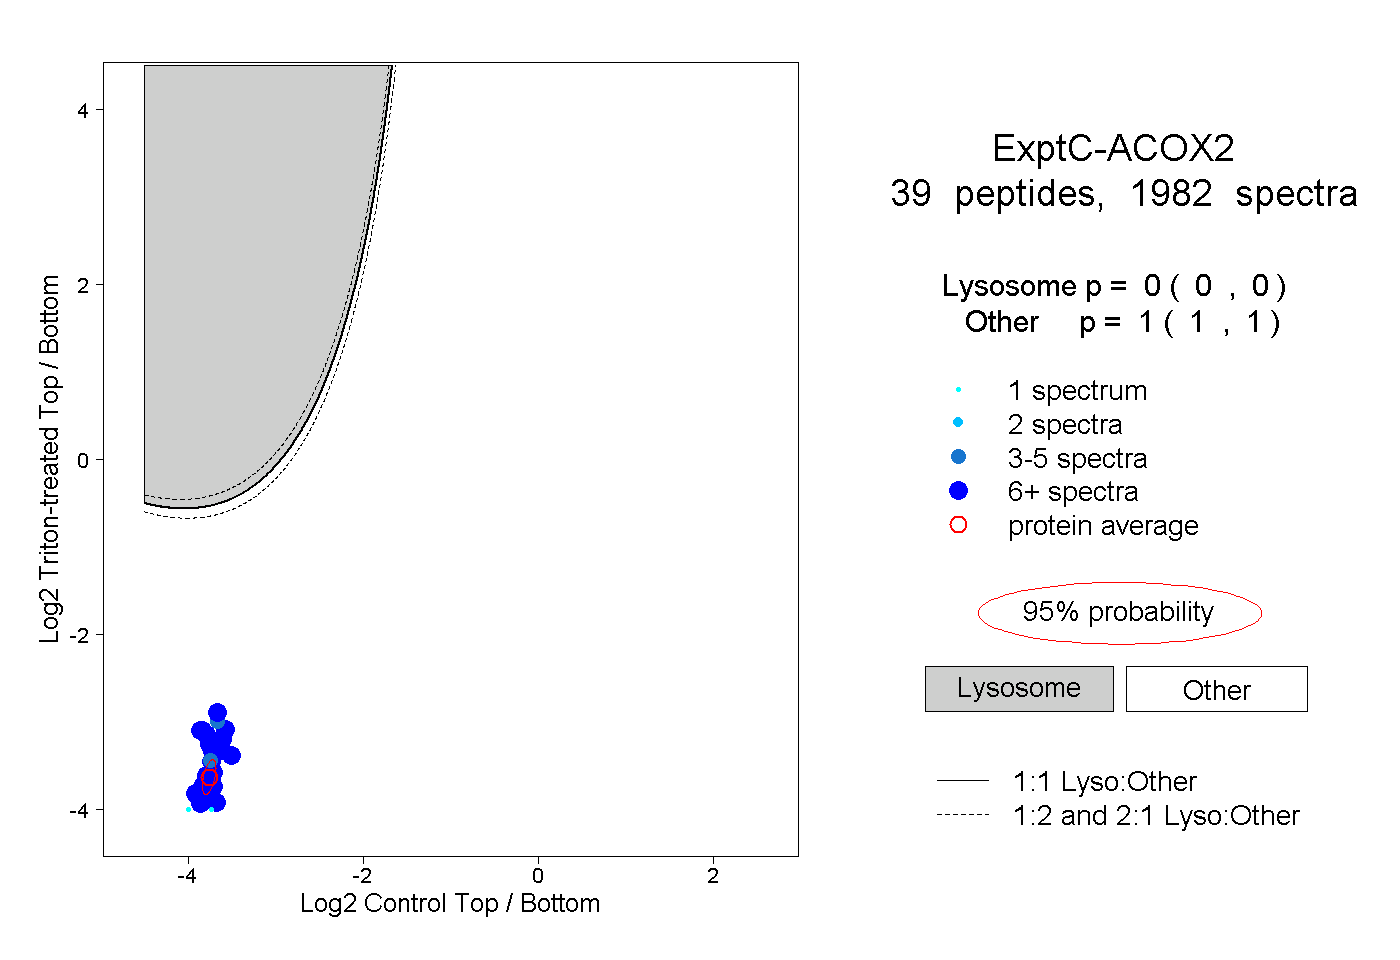
0.000 | 0.000
1.000 | 1.000
29peptides
spectra
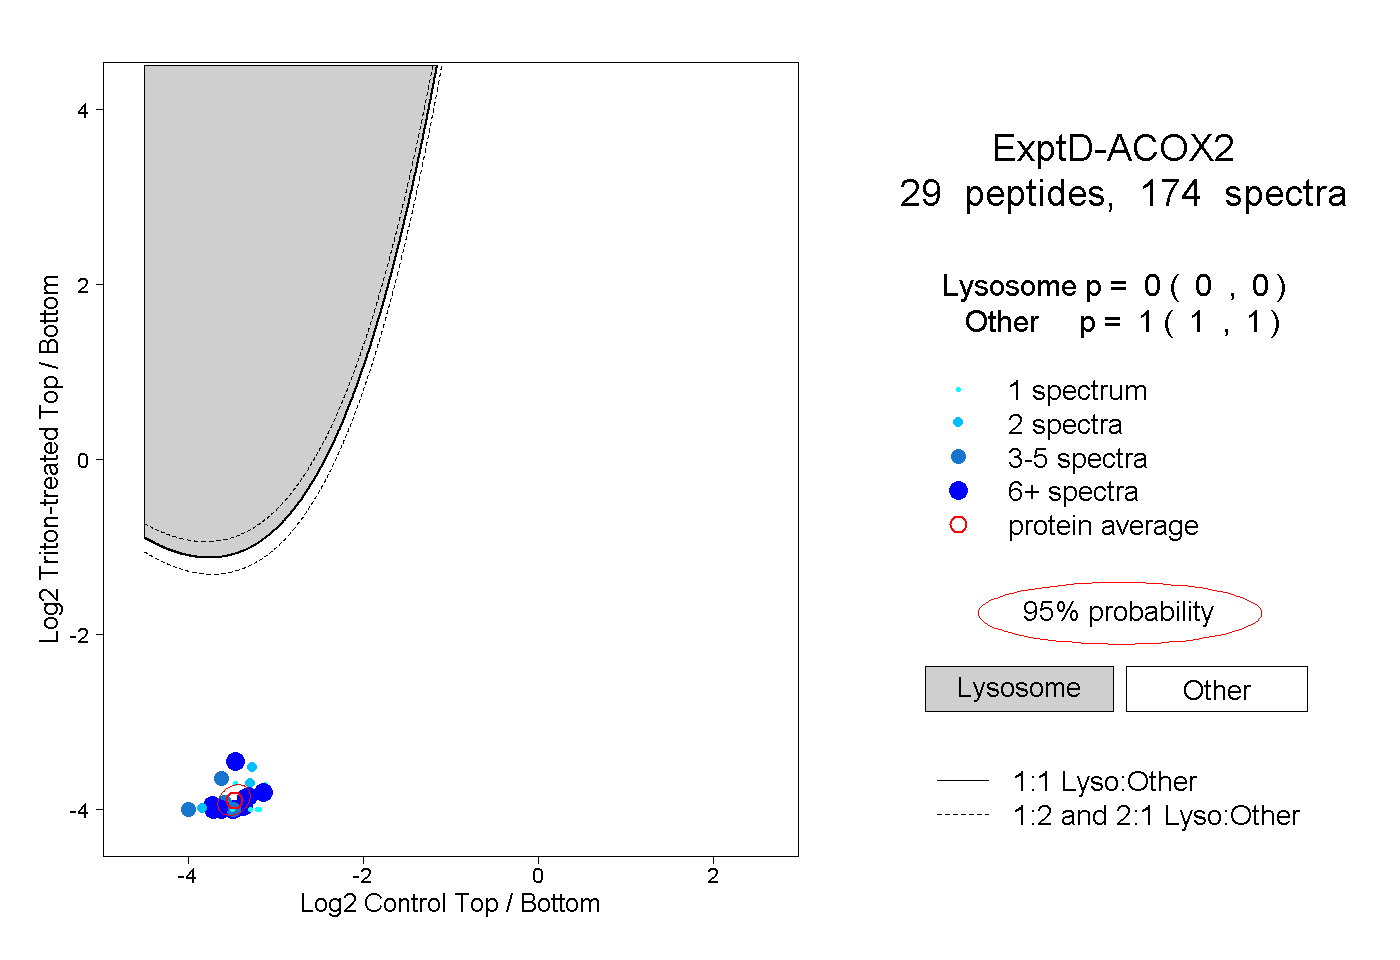
0.000 | 0.000
1.000 | 1.000