 4
4peptides
spectra
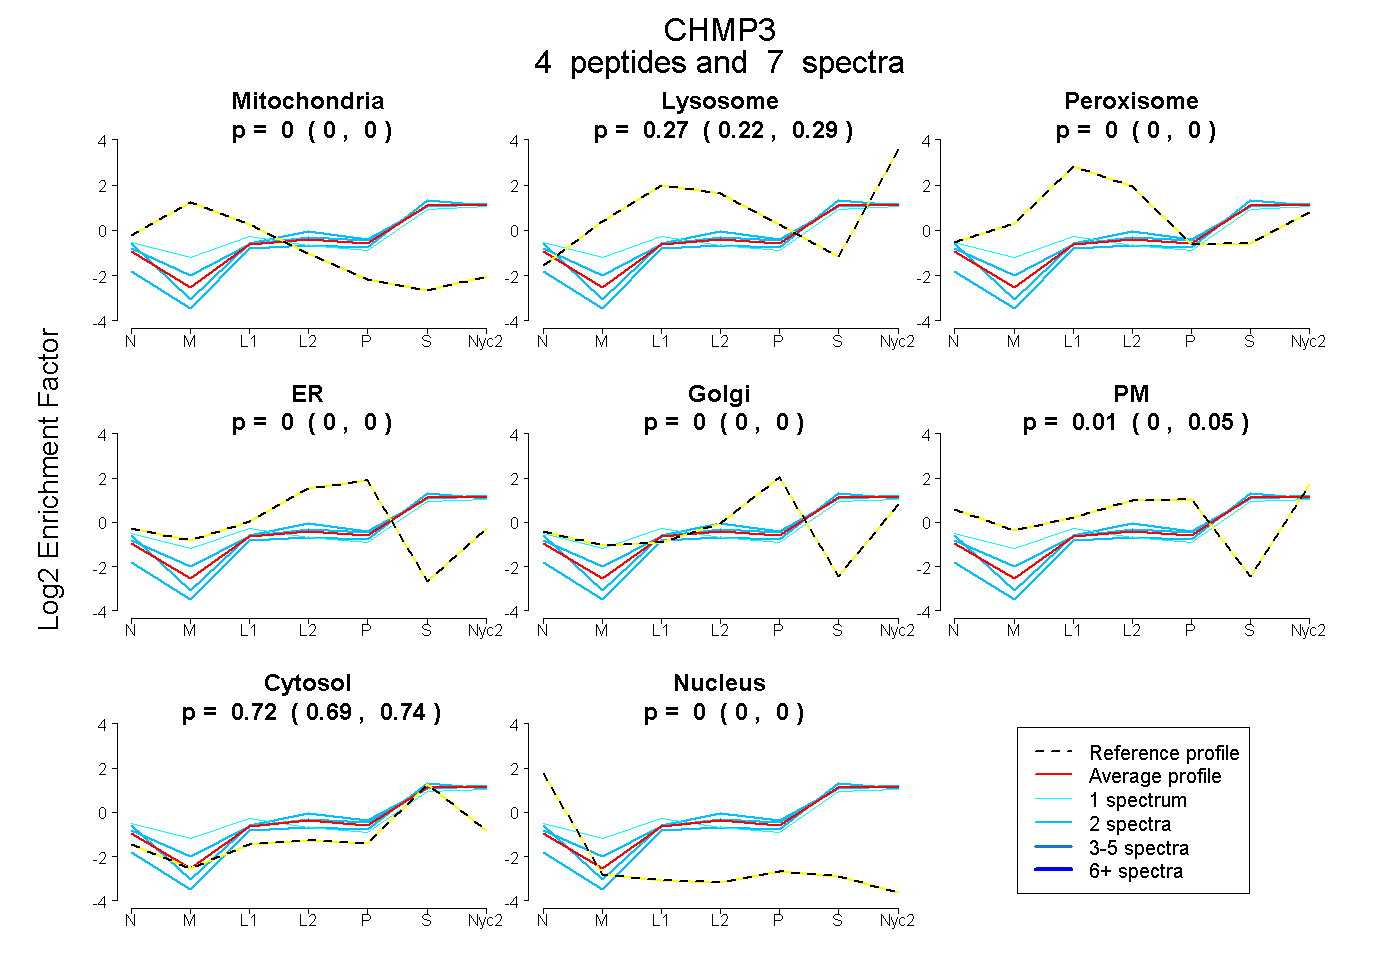
0.000 | 0.000
0.224 | 0.294
0.000 | 0.000
0.000 | 0.000
0.000 | 0.000
0.000 | 0.050
0.695 | 0.741
0.000 | 0.000
1peptide
spectrum
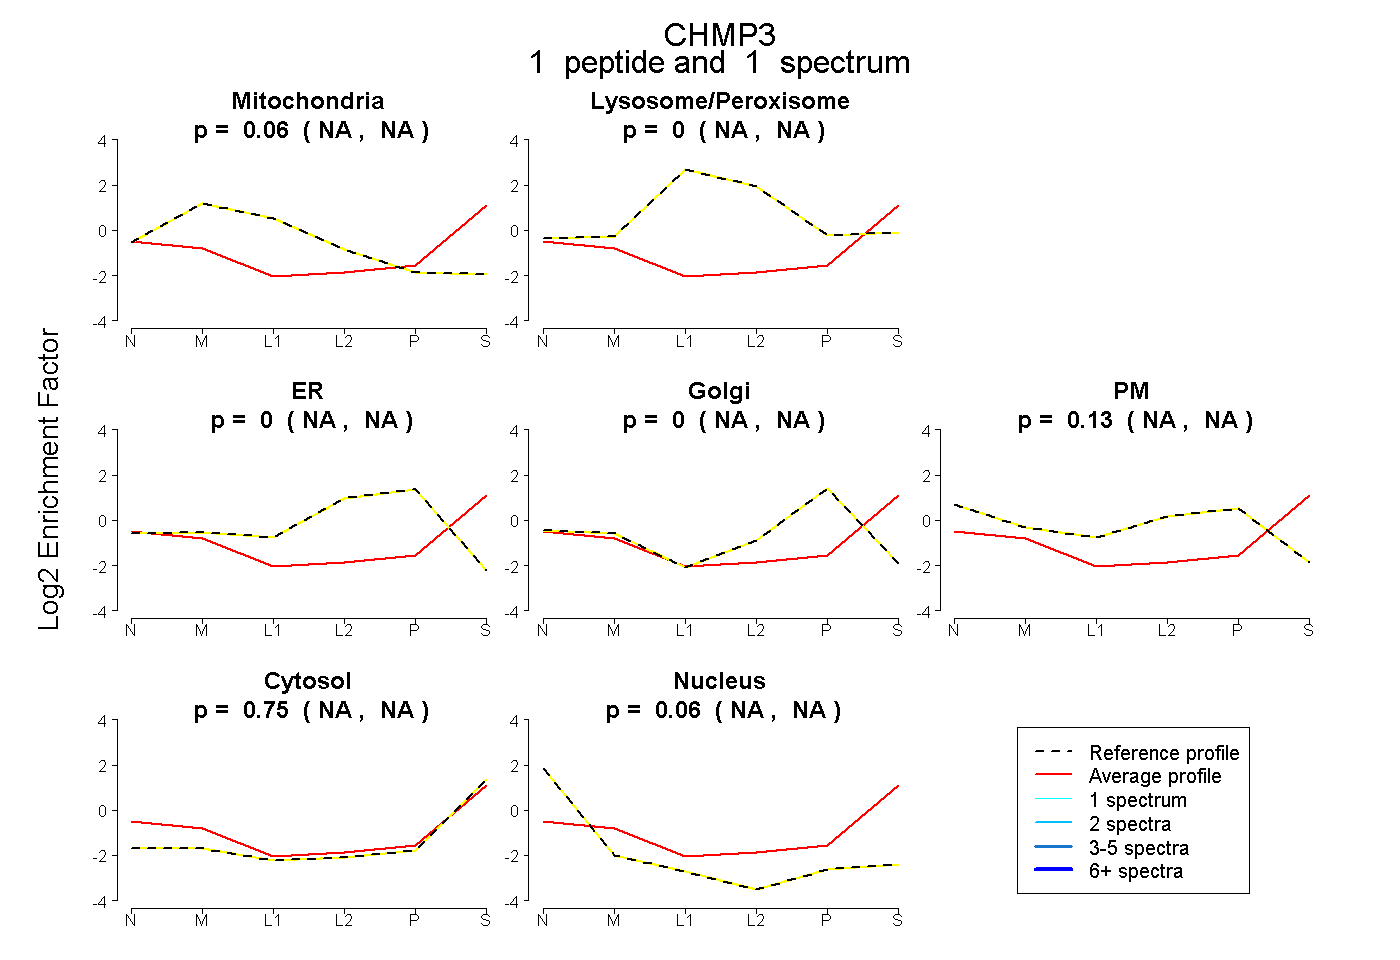
NA | NA
NA | NA
NA | NA
NA | NA
NA | NA
NA | NA
NA | NA
5peptides
spectra
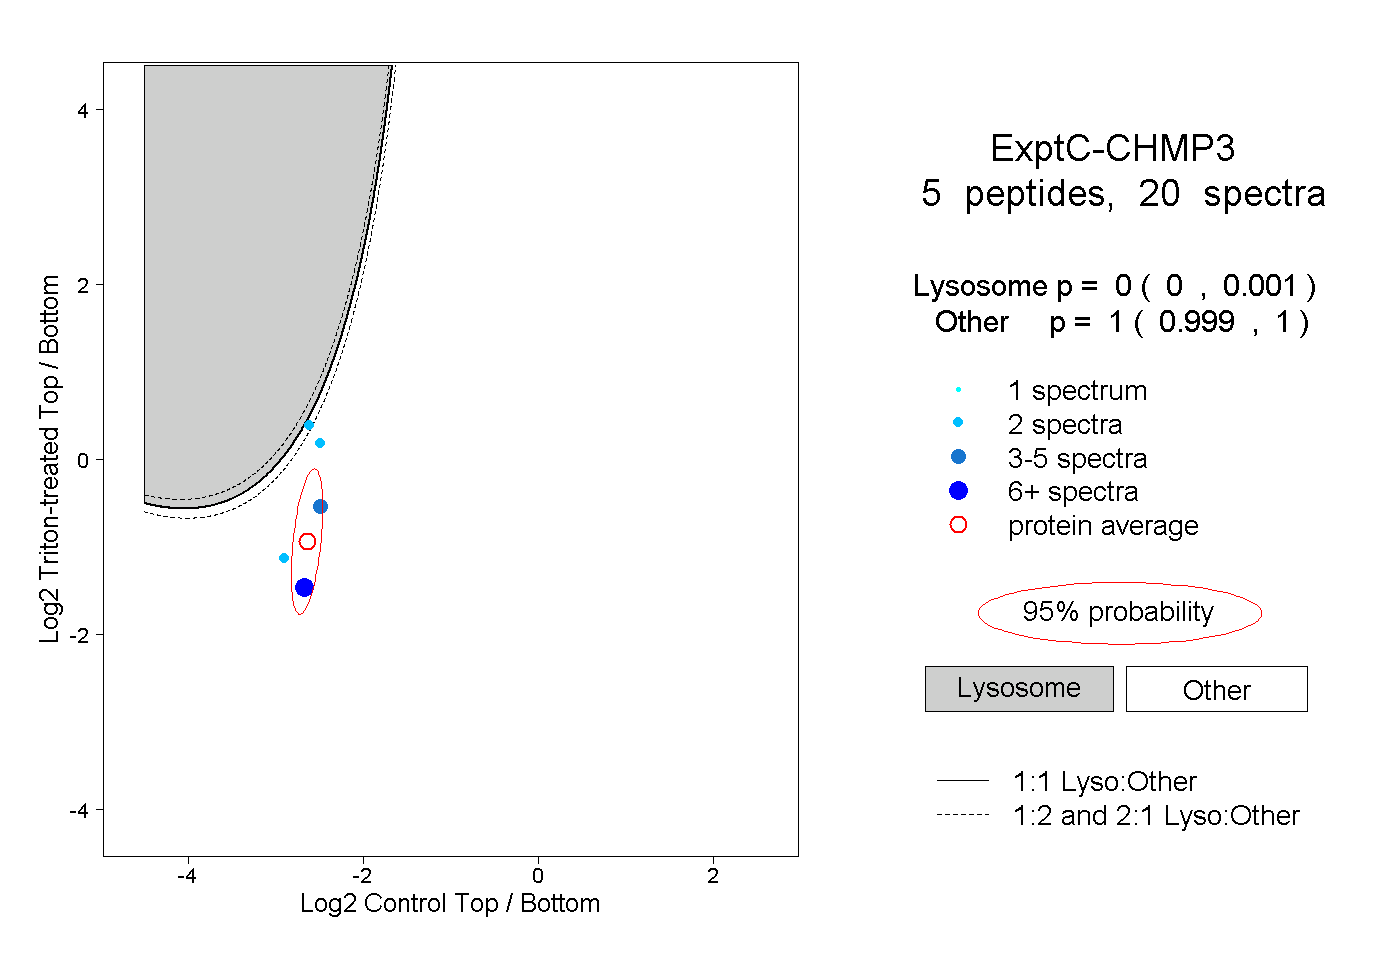
0.000 | 0.001
0.999 | 1.000
1peptide
spectra
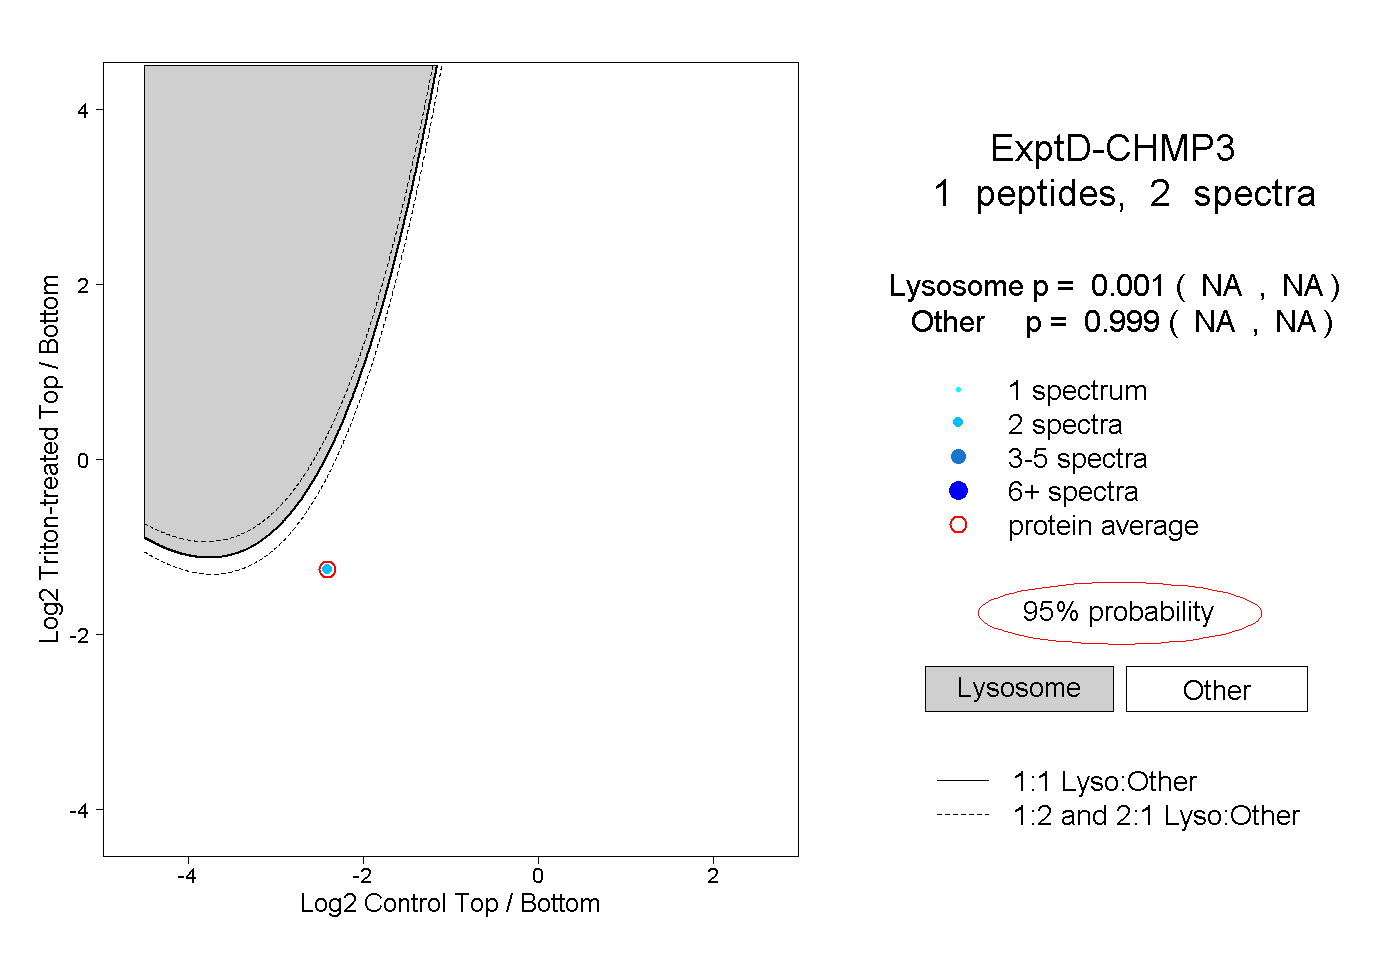
NA | NA
NA | NA