CHMP3
[ENSRNOP00000010253]
Main page
| | | Plot |
Mito |
Lyso |
|
Perox |
ER |
Golgi |
PM |
Cytosol |
Nucleus |
|
| Expt A |
 4
4
peptides |
7
spectra |
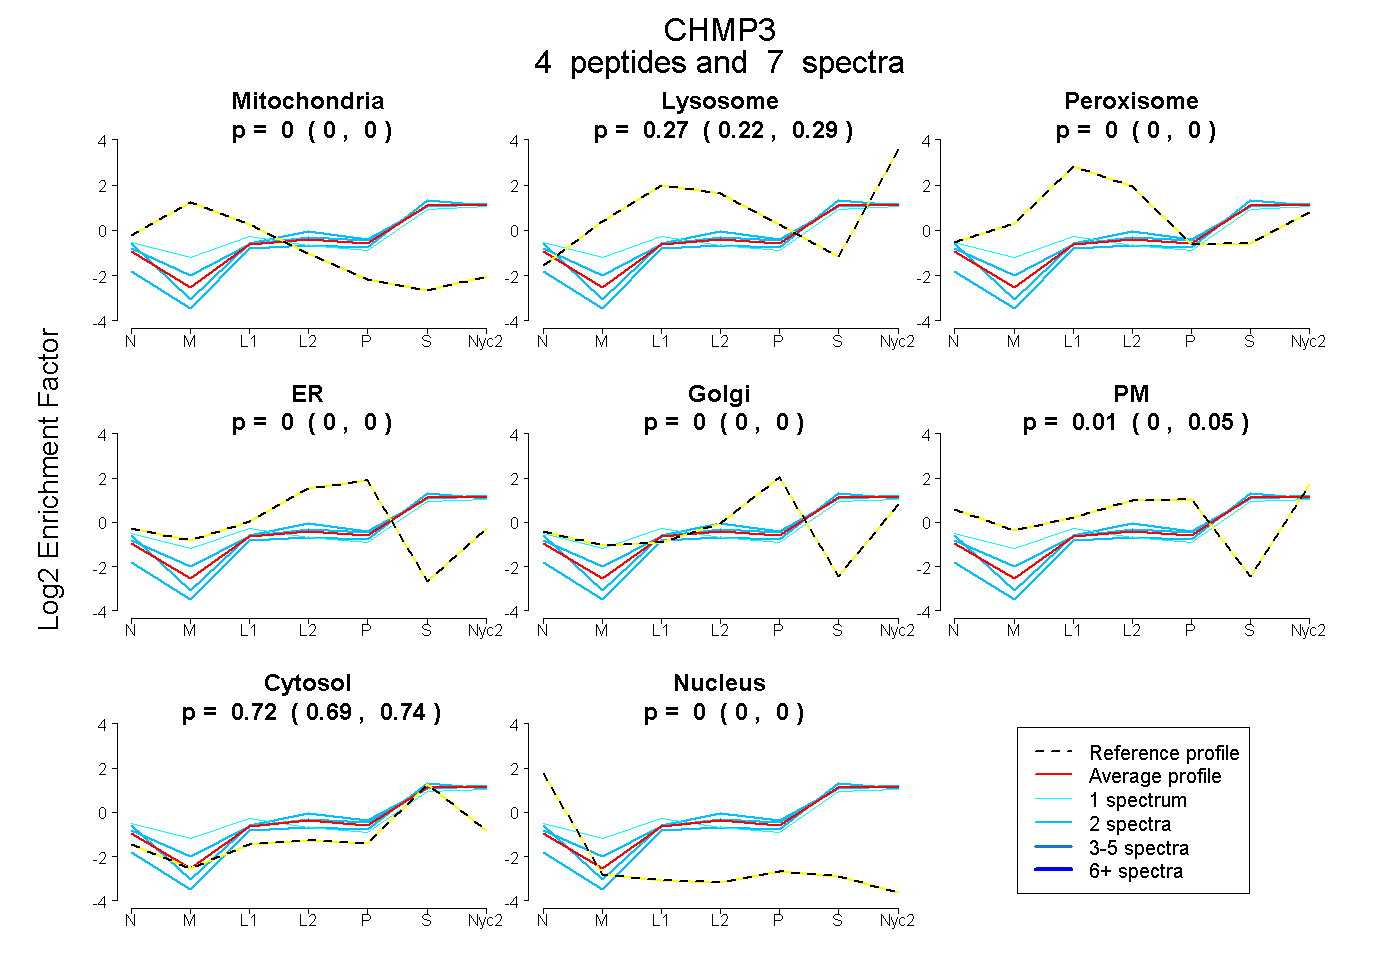 |
0.000
0.000 | 0.000 |
0.270
0.224 | 0.294 |
|
0.000
0.000 | 0.000 |
0.000
0.000 | 0.000 |
0.000
0.000 | 0.000 |
0.010
0.000 | 0.050 |
0.721
0.695 | 0.741 |
0.000
0.000 | 0.000 |
|
| | | Plot |
Mito |
|
Lyso or Perox |
|
ER |
Golgi |
PM |
Cytosol |
Nucleus |
|
| Expt B |
1
peptide |
1
spectrum |
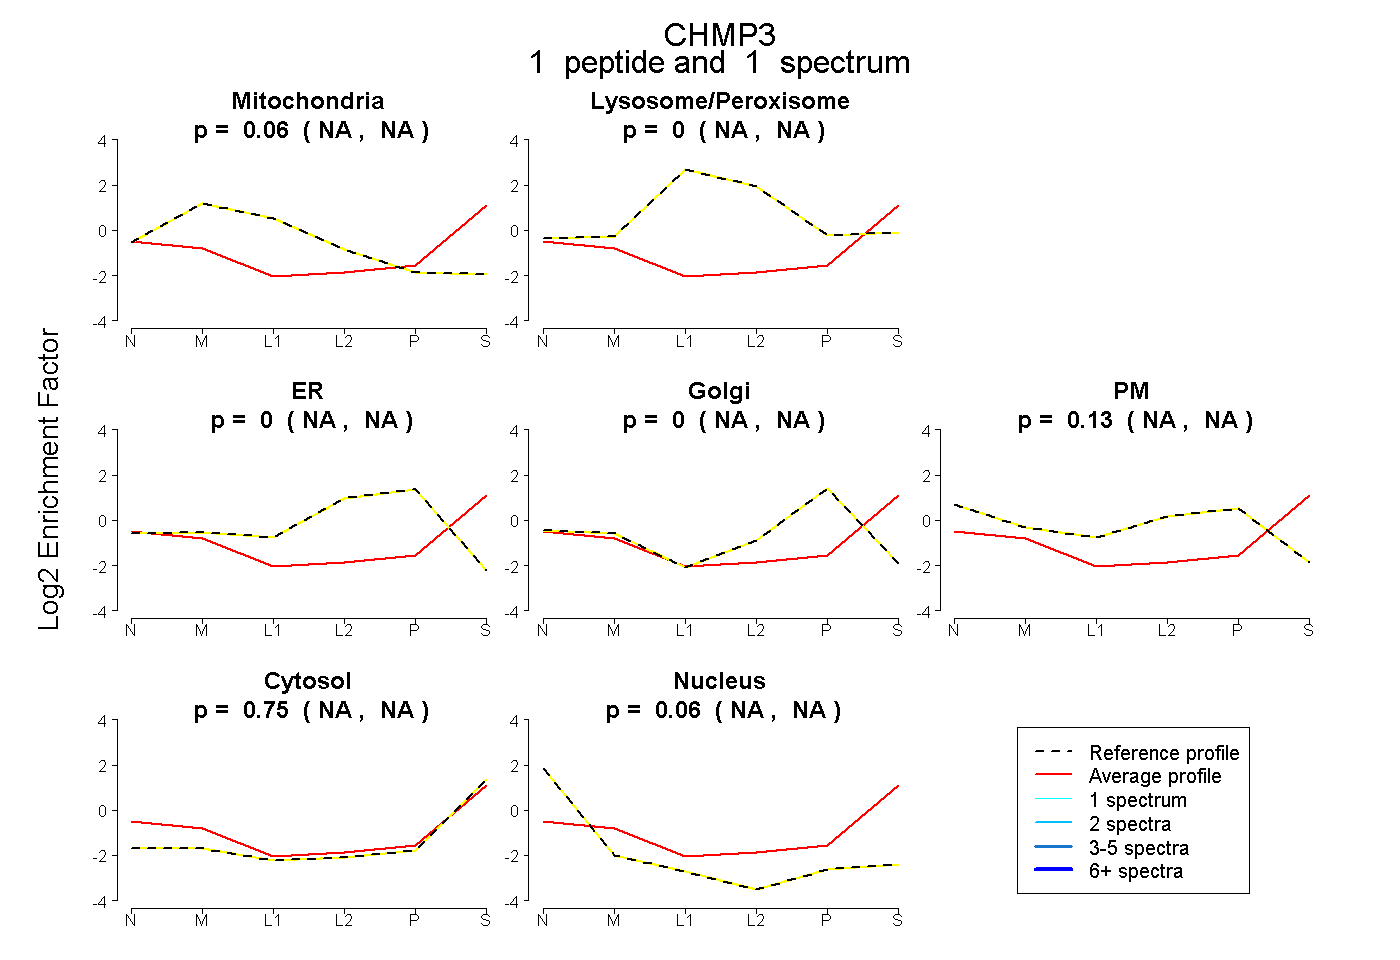 |
0.062
NA | NA |
|
0.000
NA | NA |
|
0.000
NA | NA |
0.000
NA | NA |
0.126
NA | NA |
0.753
NA | NA |
0.060
NA | NA |
|
| | | Plot |
|
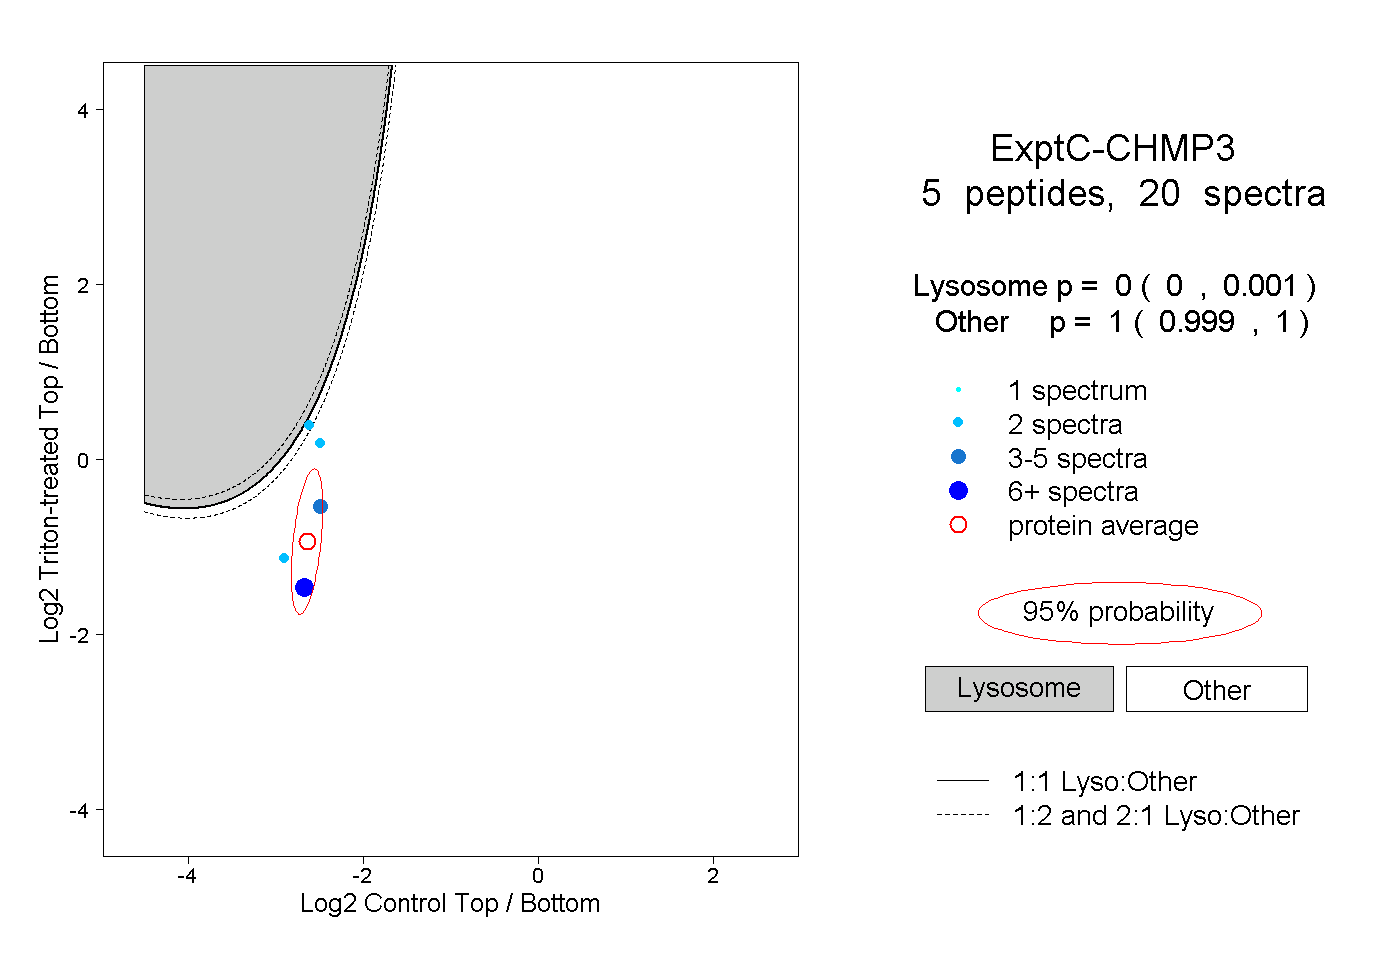
Lyso |
|
|
|
|
|
|
|
Other |
| Expt C |
5
peptides |
20
spectra |
 |
|
0.000
0.000 | 0.001 |
|
|
|
|
|
|
|
1.000
0.999 | 1.000 |
| 2 spectra, NQLAVLR |
|
0.281 |
|
|
|
|
|
|
|
0.719 |
| 3 spectra, TQEKPPK |
|
0.000 |
|
|
|
|
|
|
|
1.000 |
| 11 spectra, GLFGK |
|
0.000 |
|
|
|
|
|
|
|
1.000 |
| 2 spectra, EVCVVLAK |
|
0.011 |
|
|
|
|
|
|
|
0.989 |
| 2 spectra, IPEIQATMR |
|
0.000 |
|
|
|
|
|
|
|
1.000 |
| | | Plot |
|
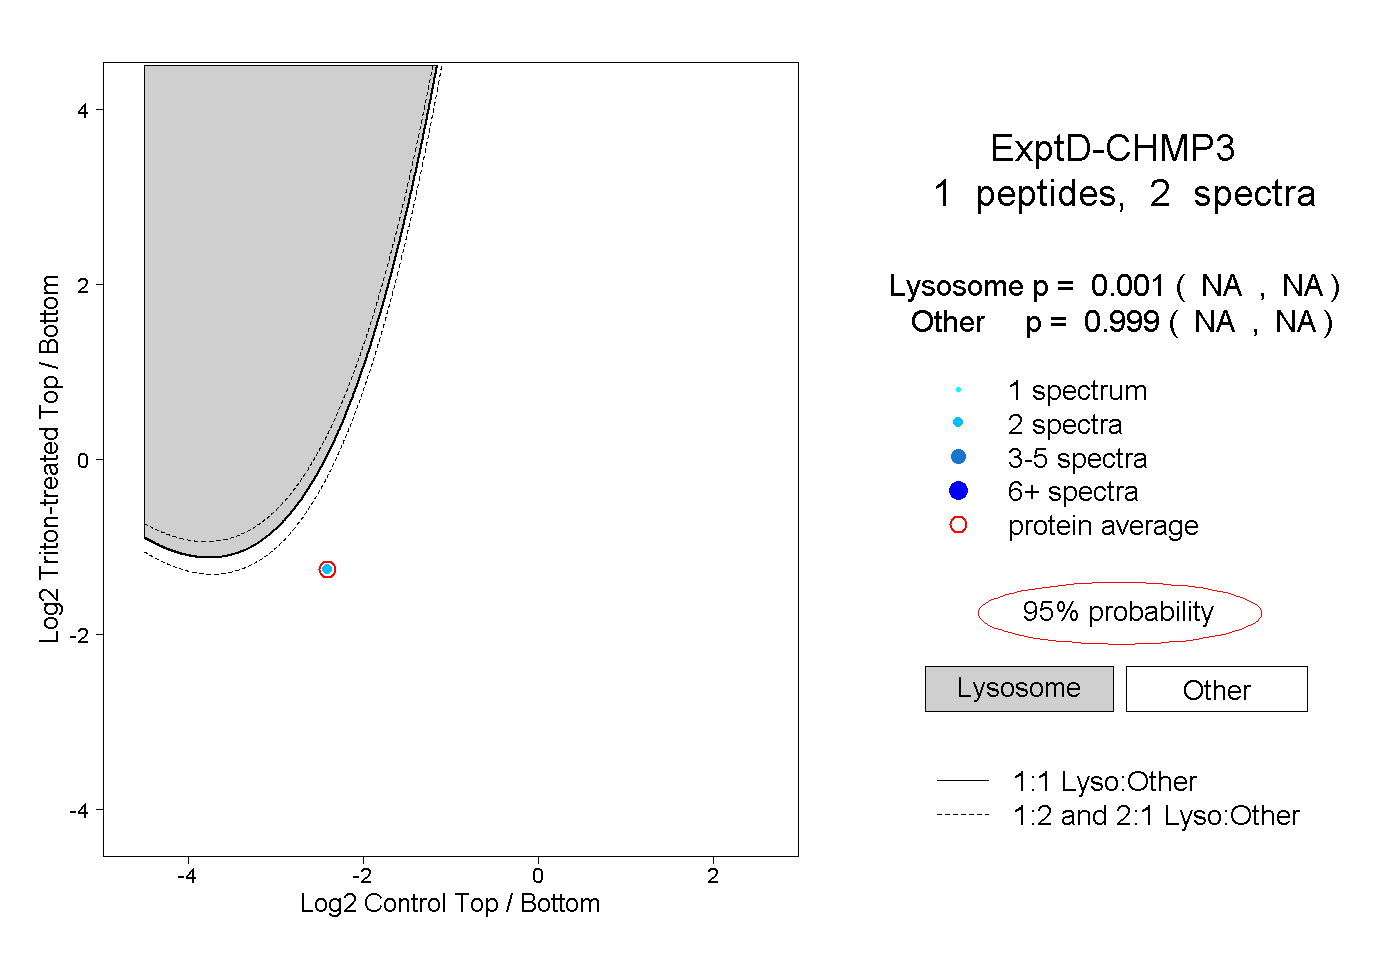
Lyso |
|
|
|
|
|
|
|
Other |
| Expt D |
1
peptide |
2
spectra |
 |
|
0.001
NA | NA |
|
|
|
|
|
|
|
0.999
NA | NA |