 8
8peptides
spectra
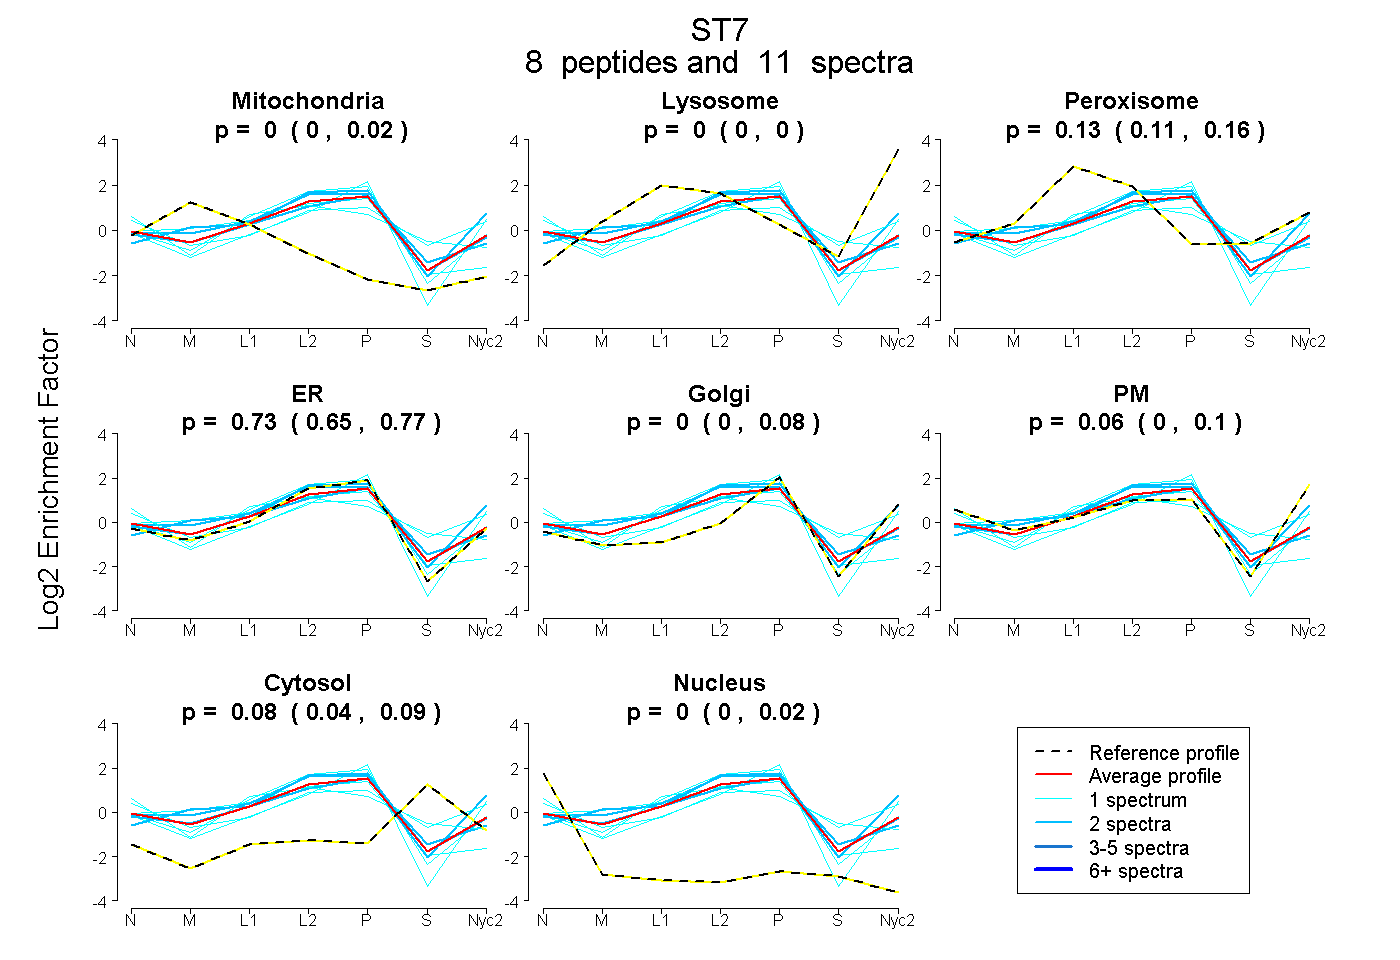
0.000 | 0.019
0.000 | 0.000
0.111 | 0.162
0.649 | 0.773
0.000 | 0.084
0.000 | 0.103
0.036 | 0.092
0.000 | 0.016
1peptide
spectrum
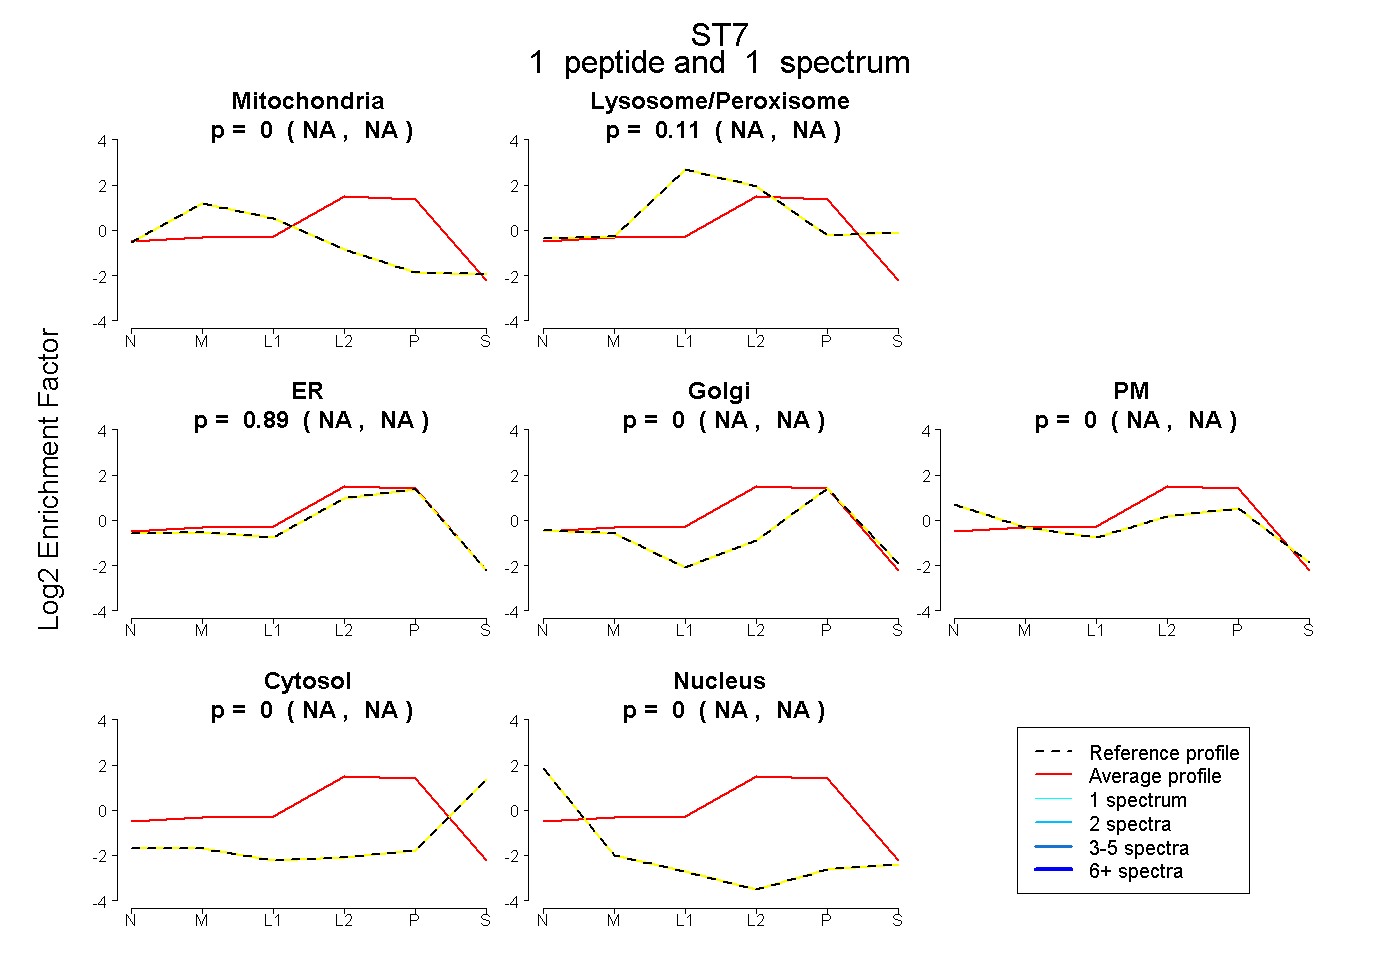
NA | NA
NA | NA
NA | NA
NA | NA
NA | NA
NA | NA
NA | NA
4peptides
spectra
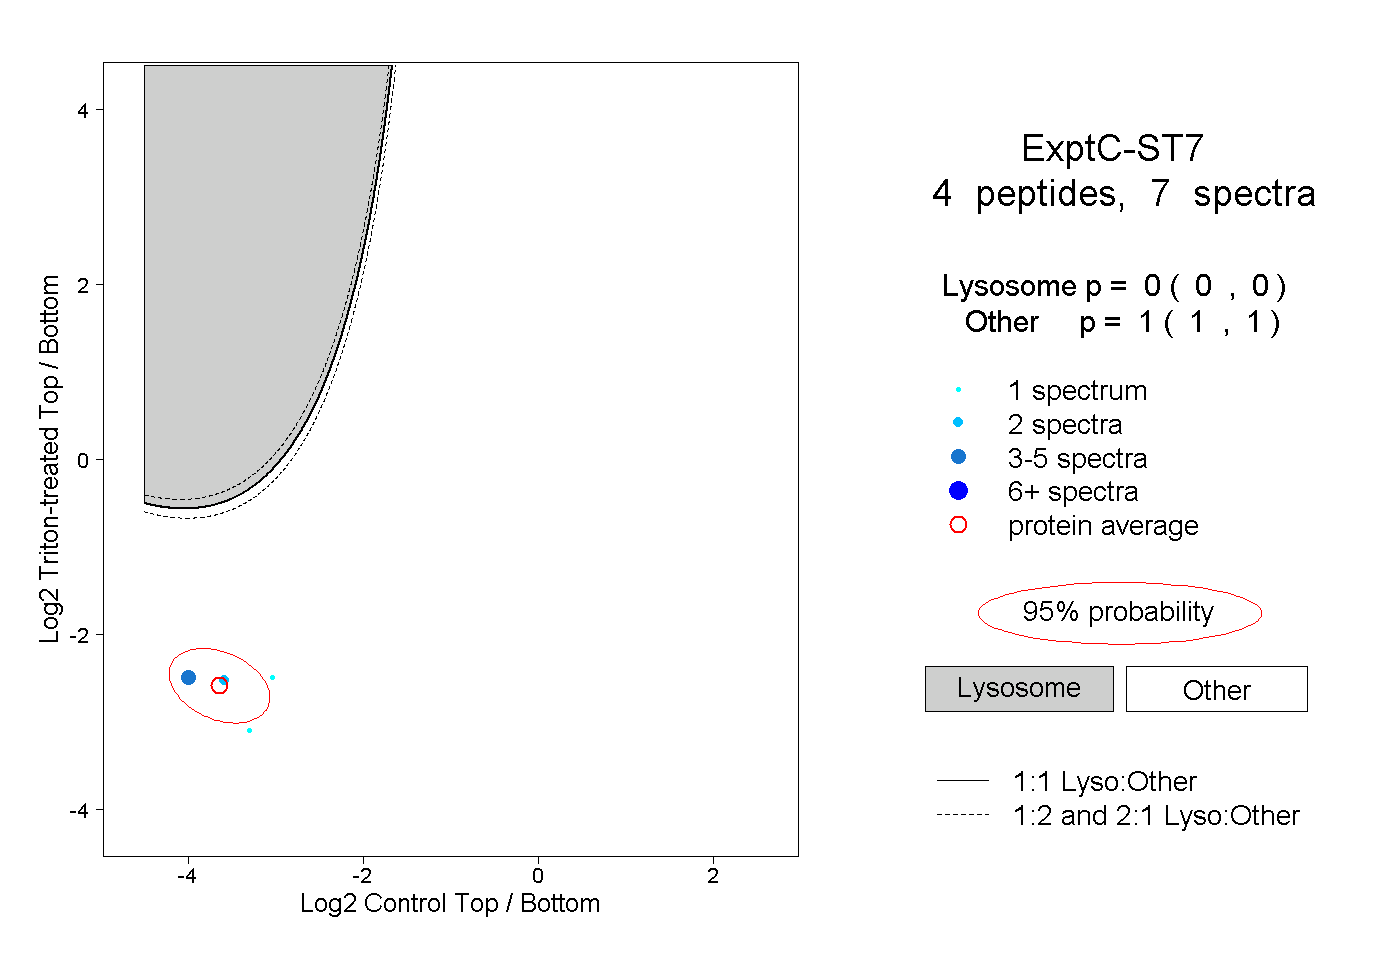
0.000 | 0.000
1.000 | 1.000