 8
8peptides
spectra
0.000 | 0.019
0.000 | 0.000
0.111 | 0.162
0.649 | 0.773
0.000 | 0.084
0.000 | 0.103
0.036 | 0.092
0.000 | 0.016
| Plot | Mito | Lyso | Perox | ER | Golgi | PM | Cytosol | Nucleus | |||||
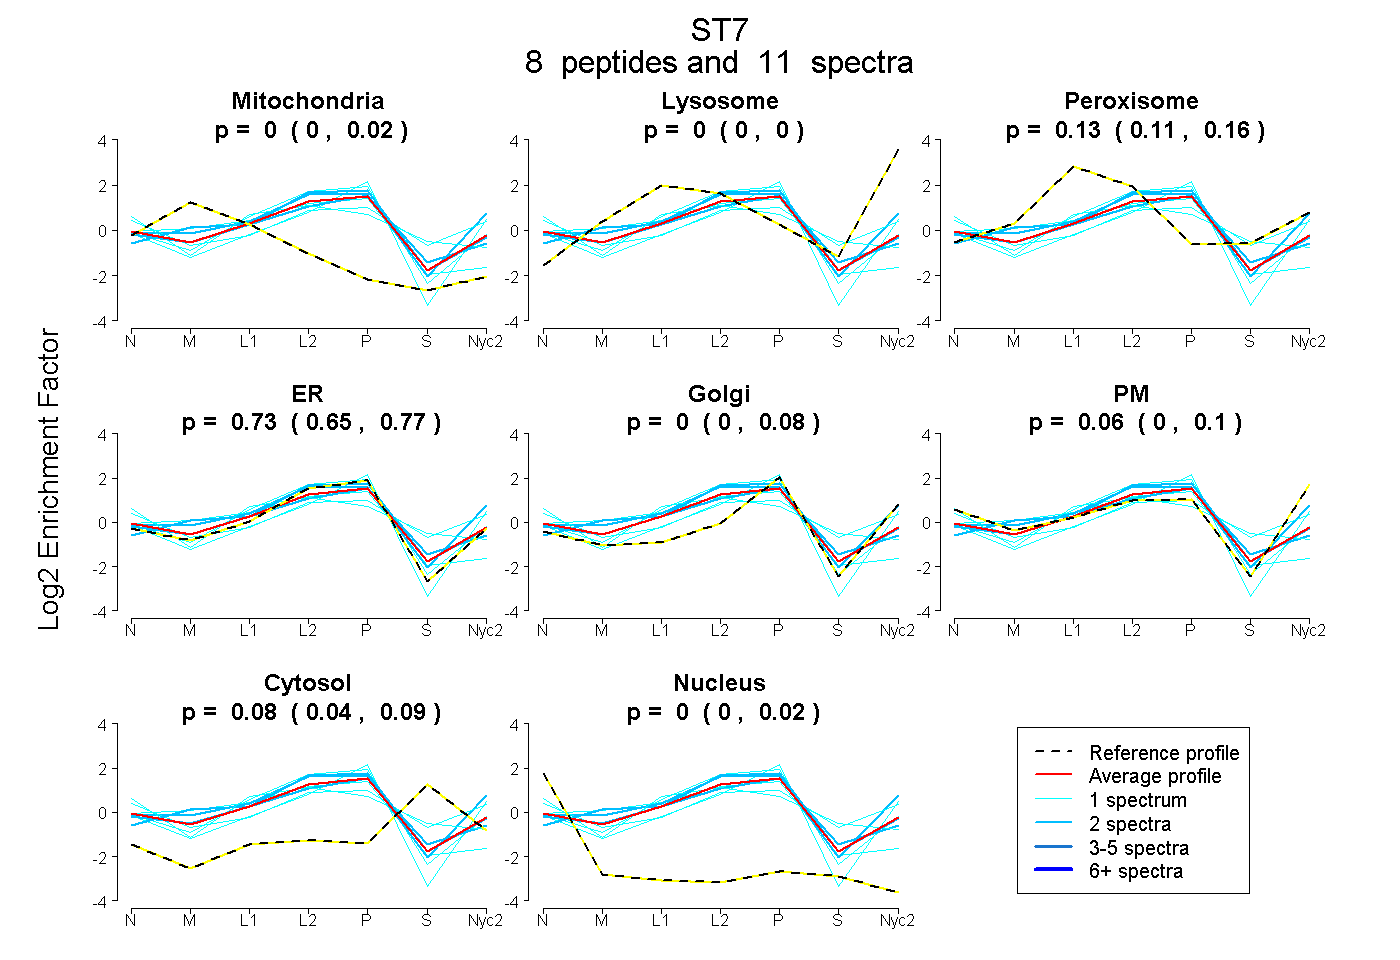
| Expt A |
8 peptides |
11 spectra |
|
0.001 0.000 | 0.019 |
0.000 0.000 | 0.000 |
0.128 0.111 | 0.162 |
0.735 0.649 | 0.773 |
0.000 0.000 | 0.084 |
0.057 0.000 | 0.103 |
0.079 0.036 | 0.092 |
0.000 0.000 | 0.016 |
| 2 spectra, LAMCAR | 0.000 | 0.146 | 0.048 | 0.588 | 0.000 | 0.218 | 0.000 | 0.000 | ||
| 1 spectrum, DTNVLVYIK | 0.000 | 0.000 | 0.100 | 0.900 | 0.000 | 0.000 | 0.000 | 0.000 | ||
| 1 spectrum, SATICYTAALLK | 0.000 | 0.000 | 0.076 | 0.252 | 0.000 | 0.426 | 0.246 | 0.000 | ||
| 2 spectra, SLILPPEHILK | 0.075 | 0.000 | 0.150 | 0.689 | 0.008 | 0.000 | 0.078 | 0.000 | ||
| 1 spectrum, AEAGSGFLEQLK | 0.000 | 0.000 | 0.000 | 0.515 | 0.422 | 0.063 | 0.000 | 0.000 | ||
| 2 spectra, YTWVTGR | 0.000 | 0.000 | 0.127 | 0.835 | 0.000 | 0.000 | 0.038 | 0.000 | ||
| 1 spectrum, AVEFNPHVPK | 0.227 | 0.000 | 0.036 | 0.737 | 0.000 | 0.000 | 0.000 | 0.000 | ||
| 1 spectrum, YDDISLPK | 0.000 | 0.000 | 0.335 | 0.425 | 0.000 | 0.000 | 0.172 | 0.068 |
| Plot | Mito | Lyso or Perox | ER | Golgi | PM | Cytosol | Nucleus | ||||||
| Expt B |
1 peptide |
1 spectrum |
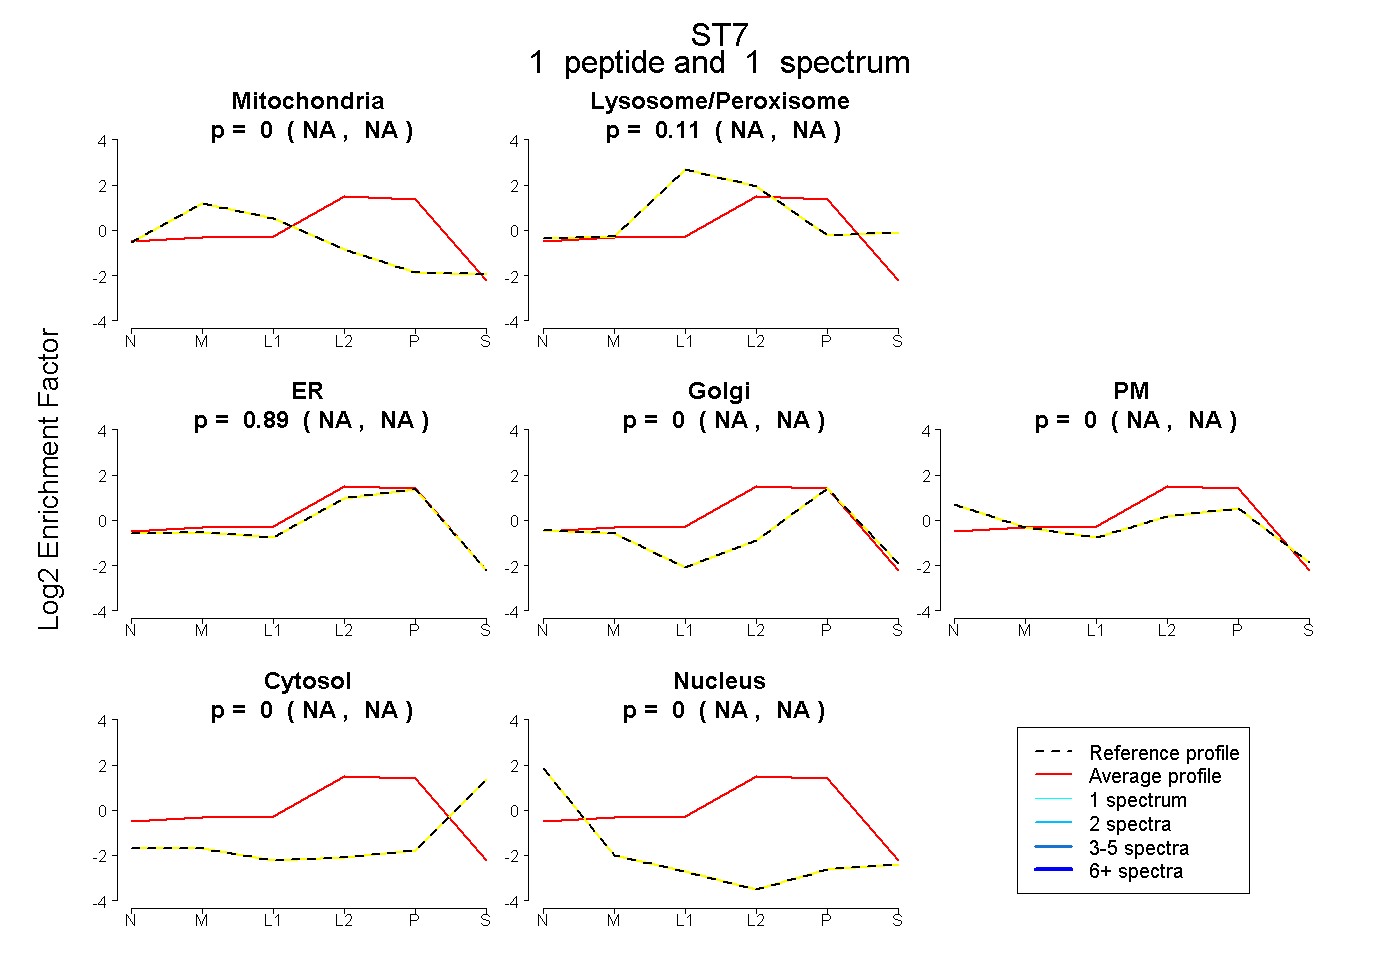 |
0.000 NA | NA |
0.106 NA | NA |
0.894 NA | NA |
0.000 NA | NA |
0.000 NA | NA |
0.000 NA | NA |
0.000 NA | NA |
|||
| Plot | Lyso | Other | |||||||||||
| Expt C |
4 peptides |
7 spectra |
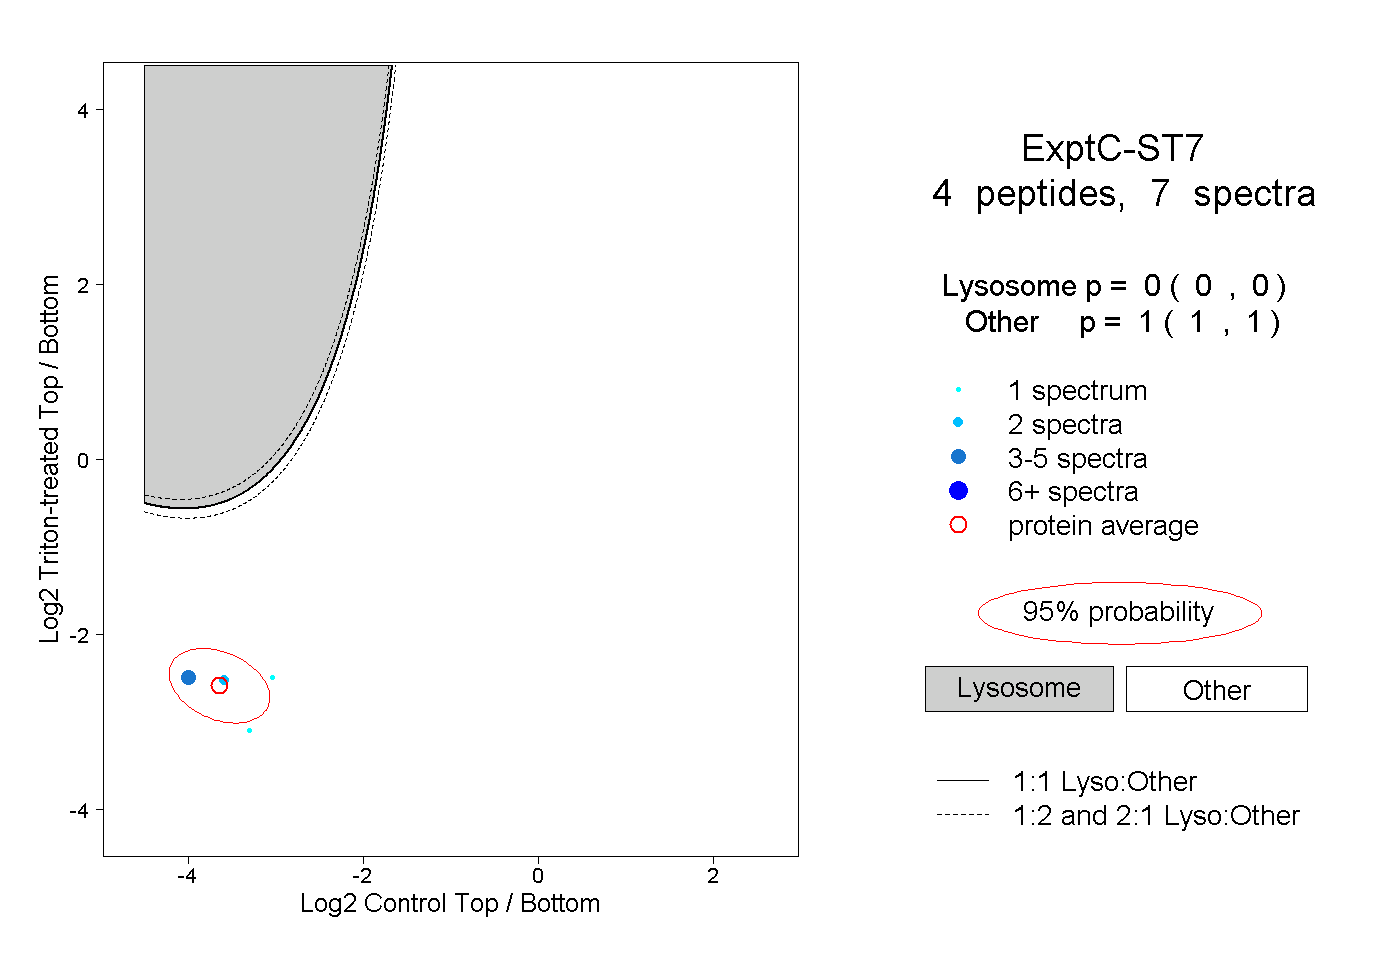 |
0.000 0.000 | 0.000 |
1.000 1.000 | 1.000 |