 21
21peptides
spectra
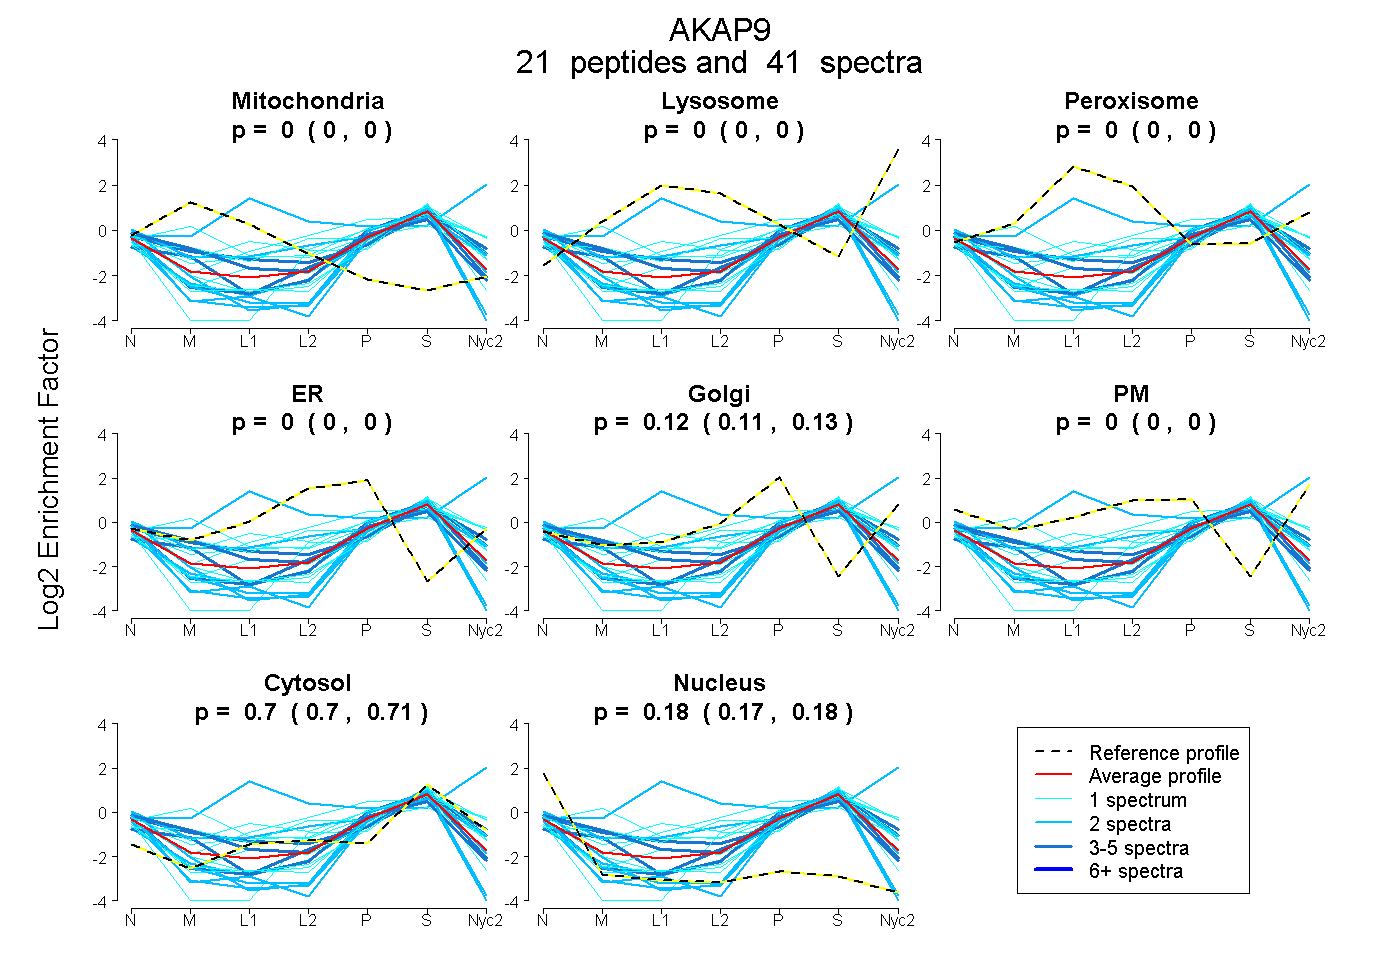
0.000 | 0.000
0.000 | 0.000
0.000 | 0.000
0.000 | 0.000
0.111 | 0.128
0.000 | 0.000
0.699 | 0.708
0.166 | 0.184
4peptides
spectra
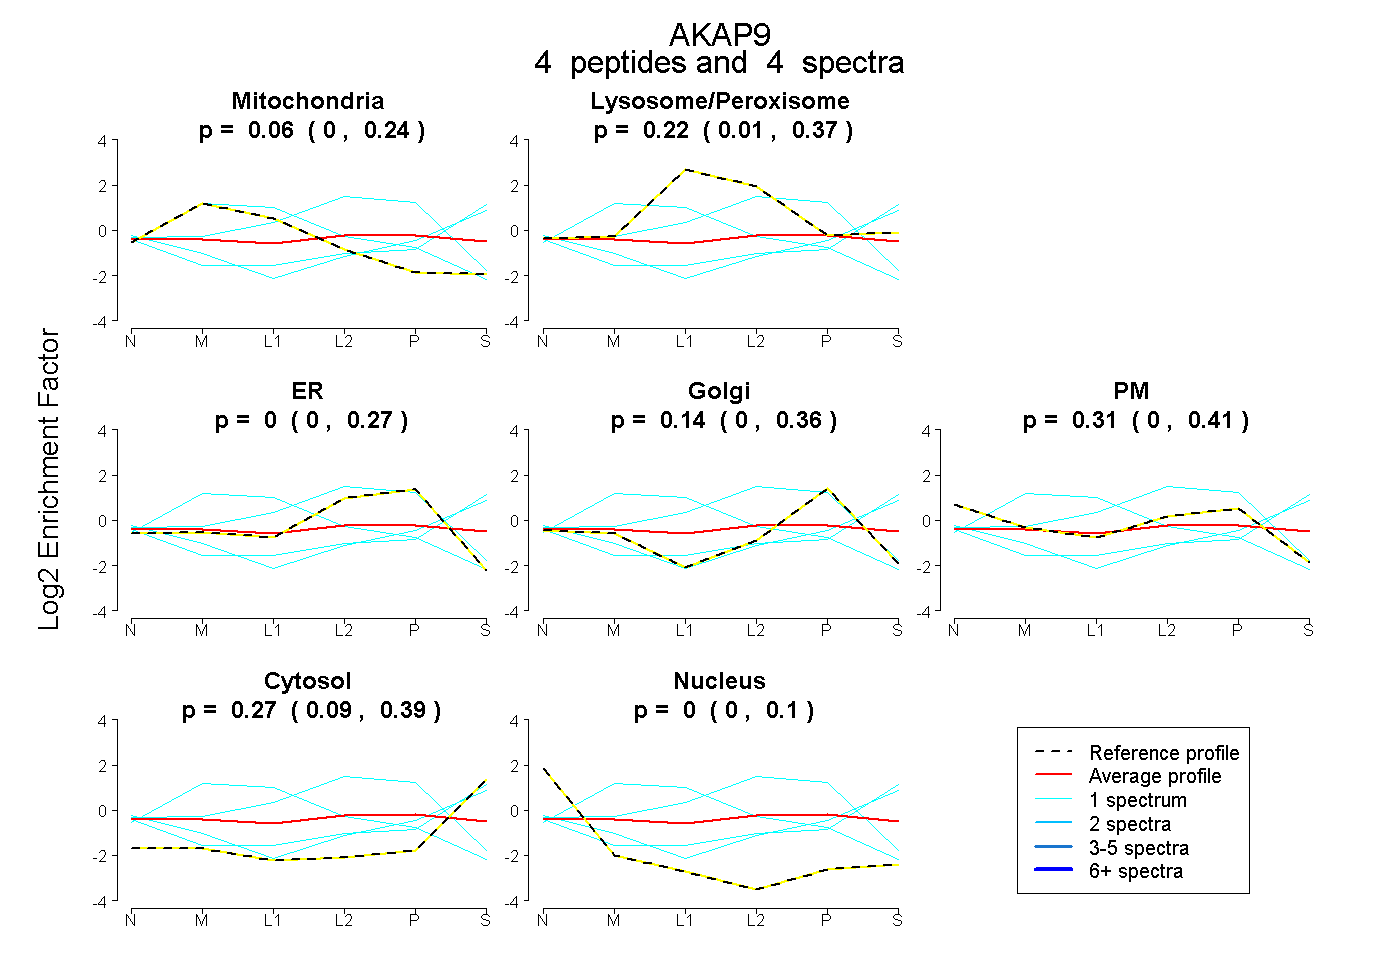
0.000 | 0.238
0.008 | 0.372
0.000 | 0.267
0.000 | 0.364
0.000 | 0.407
0.089 | 0.387
0.000 | 0.098