AKAP9
[ENSRNOP00000010118]
Main page
| | | Plot |
Mito |
Lyso |
|
Perox |
ER |
Golgi |
PM |
Cytosol |
Nucleus |
|
| Expt A |
 21
21
peptides |
41
spectra |
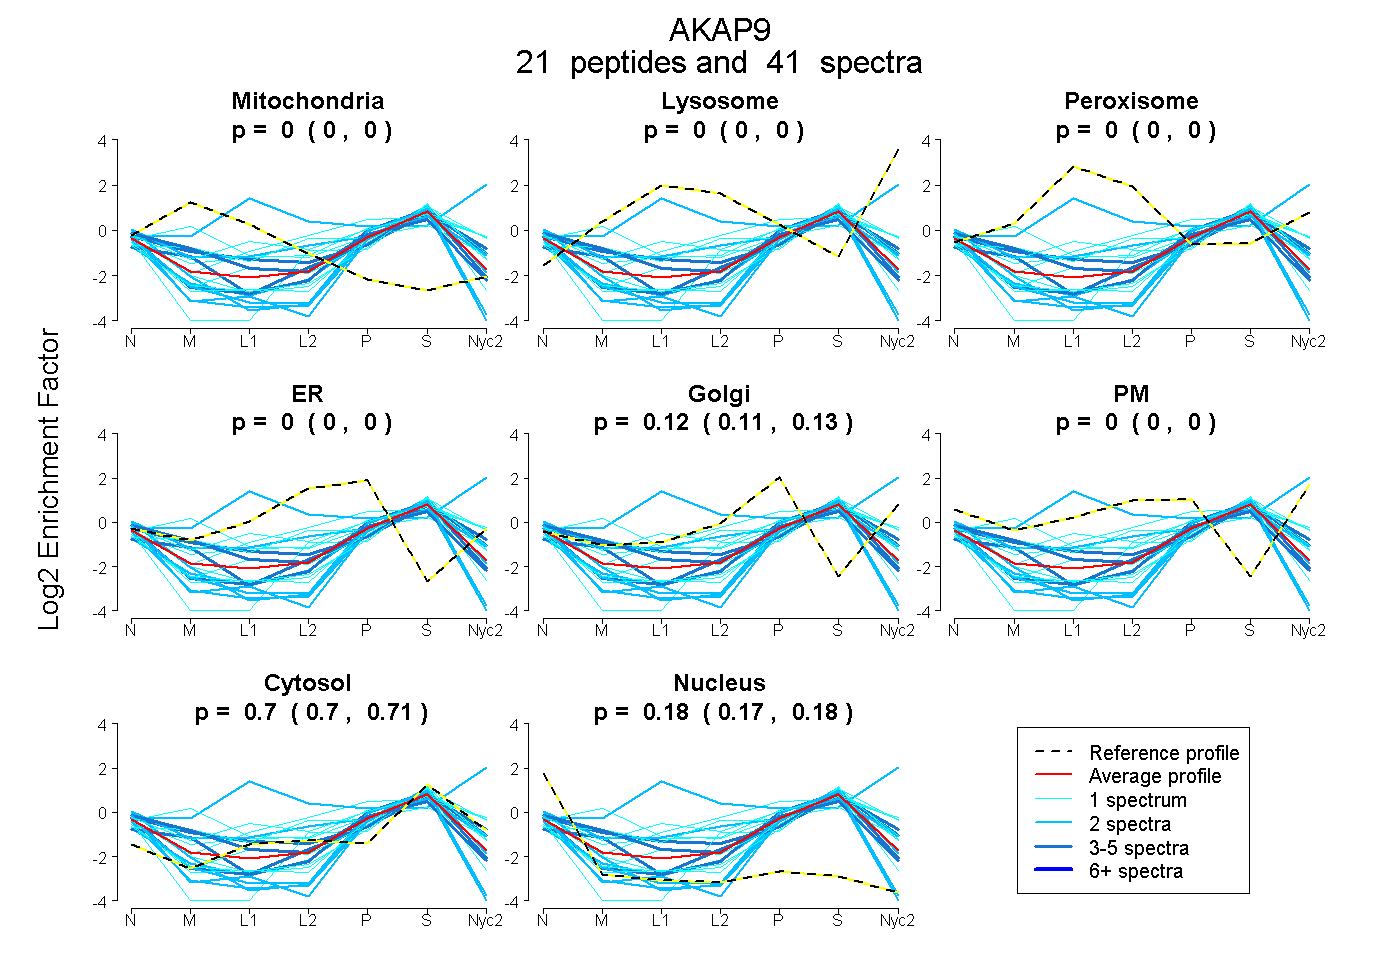 |
0.000
0.000 | 0.000 |
0.000
0.000 | 0.000 |
|
0.000
0.000 | 0.000 |
0.000
0.000 | 0.000 |
0.120
0.111 | 0.128 |
0.000
0.000 | 0.000 |
0.704
0.699 | 0.708 |
0.176
0.166 | 0.184 |
|
| | | Plot |
Mito |
|
Lyso or Perox |
|
ER |
Golgi |
PM |
Cytosol |
Nucleus |
|
| Expt B |
4
peptides |
4
spectra |
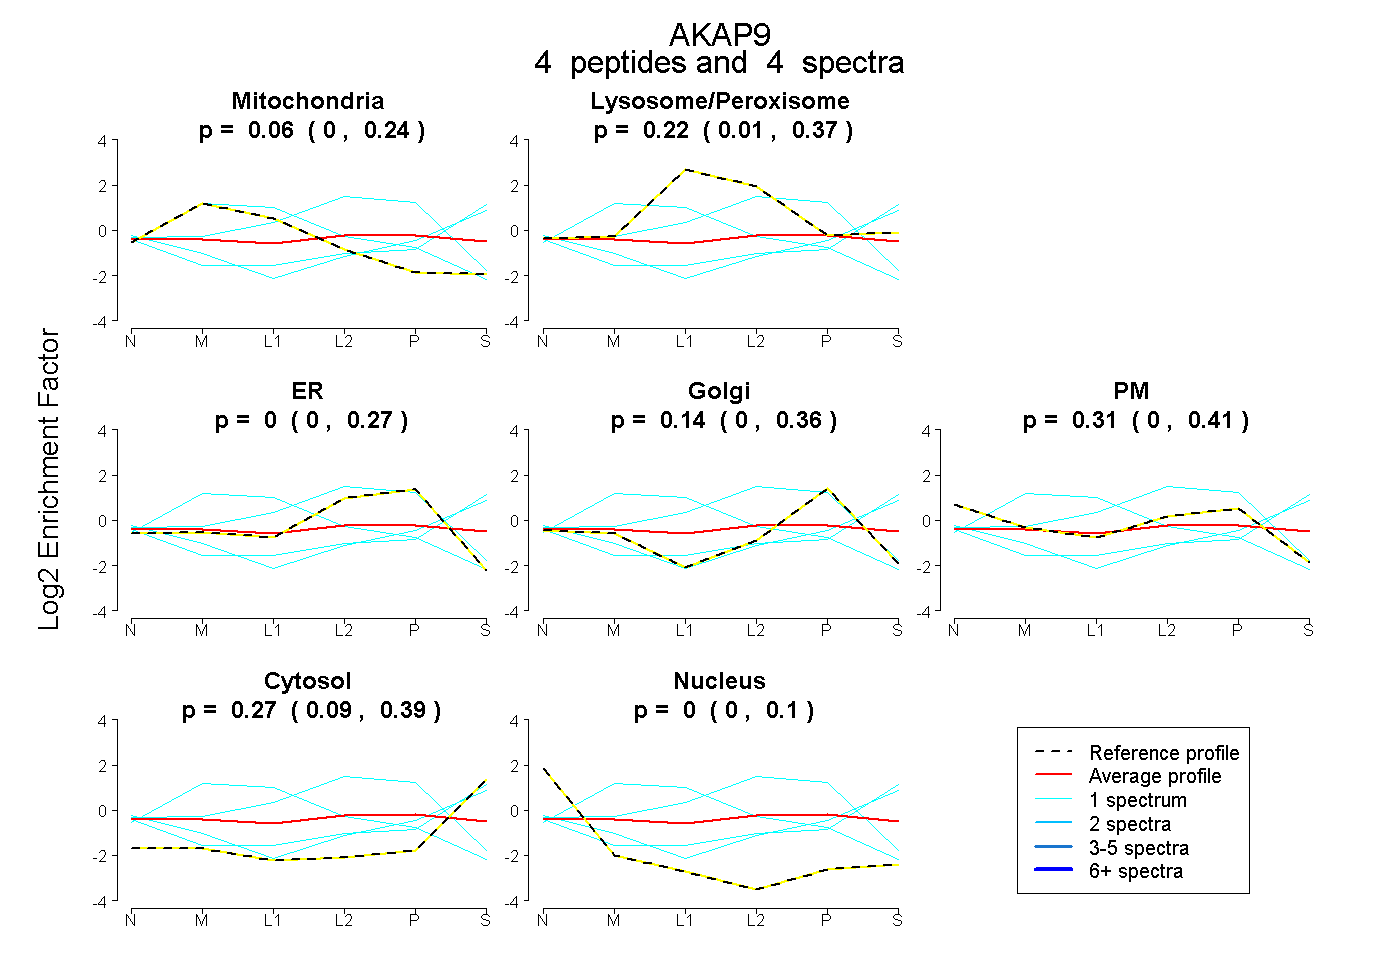 |
0.060
0.000 | 0.238 |
|
0.219
0.008 | 0.372 |
|
0.000
0.000 | 0.267 |
0.143
0.000 | 0.364 |
0.309
0.000 | 0.407 |
0.268
0.089 | 0.387 |
0.000
0.000 | 0.098 |
|
| 1 spectrum, LEVTR |
0.000 |
|
0.105 |
|
0.000 |
0.000 |
0.209 |
0.686 |
0.000 |
|
| 1 spectrum, EVEQLTNHLK |
0.726 |
|
0.115 |
|
0.159 |
0.000 |
0.000 |
0.000 |
0.000 |
|
| 1 spectrum, LLVLQTR |
0.000 |
|
0.000 |
|
0.000 |
0.024 |
0.349 |
0.627 |
0.000 |
|
| 1 spectrum, QLVMQK |
0.000 |
|
0.283 |
|
0.717 |
0.000 |
0.000 |
0.000 |
0.000 |
|