 7
7peptides
spectra
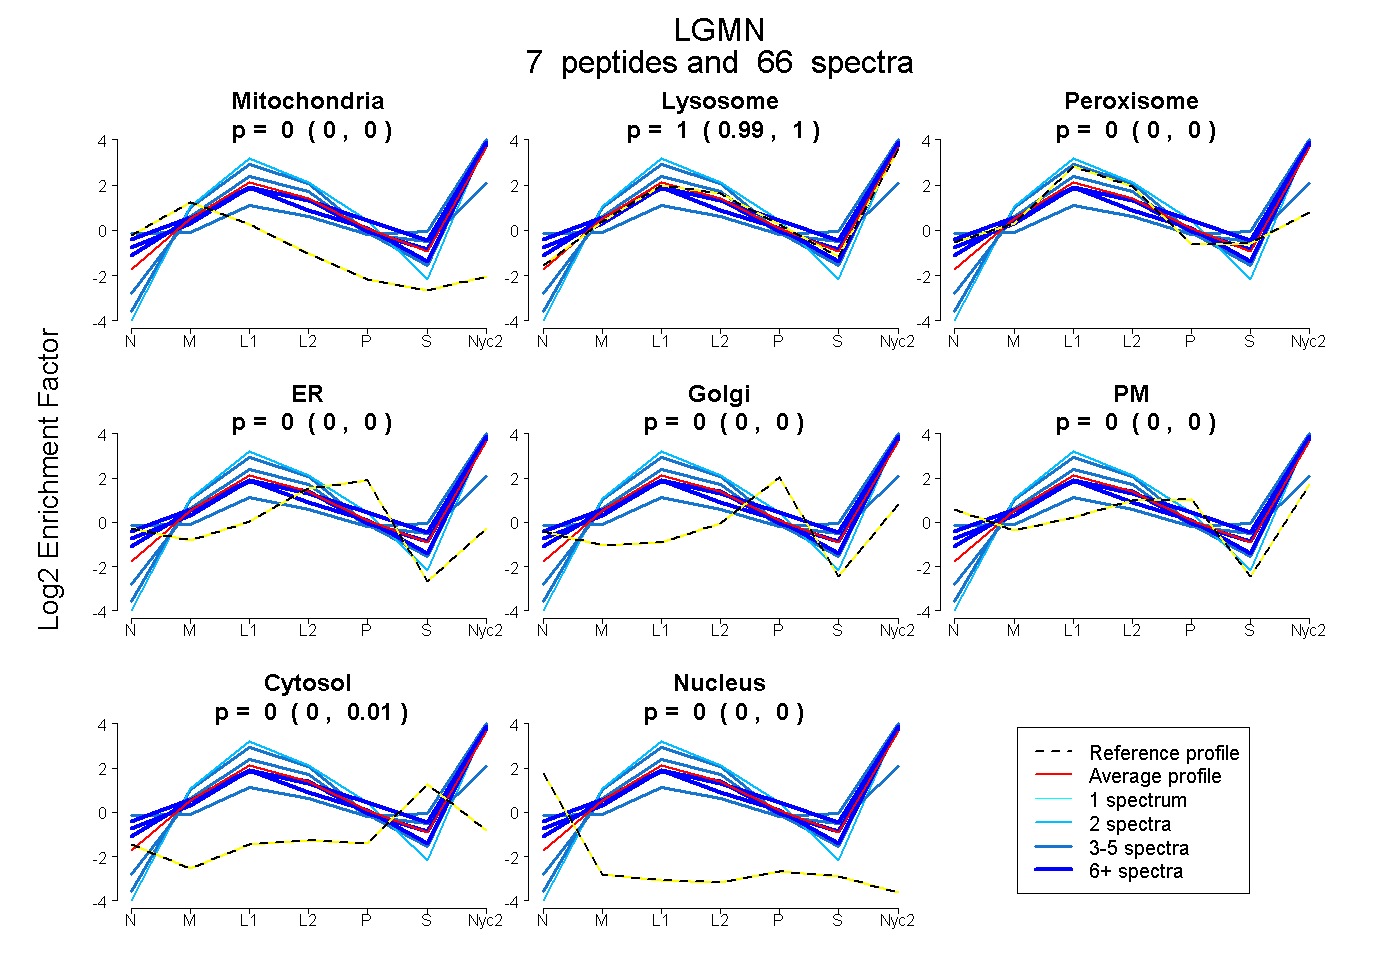
0.000 | 0.000
0.988 | 1.000
0.000 | 0.000
0.000 | 0.000
0.000 | 0.000
0.000 | 0.000
0.000 | 0.010
0.000 | 0.000
6peptides
spectra
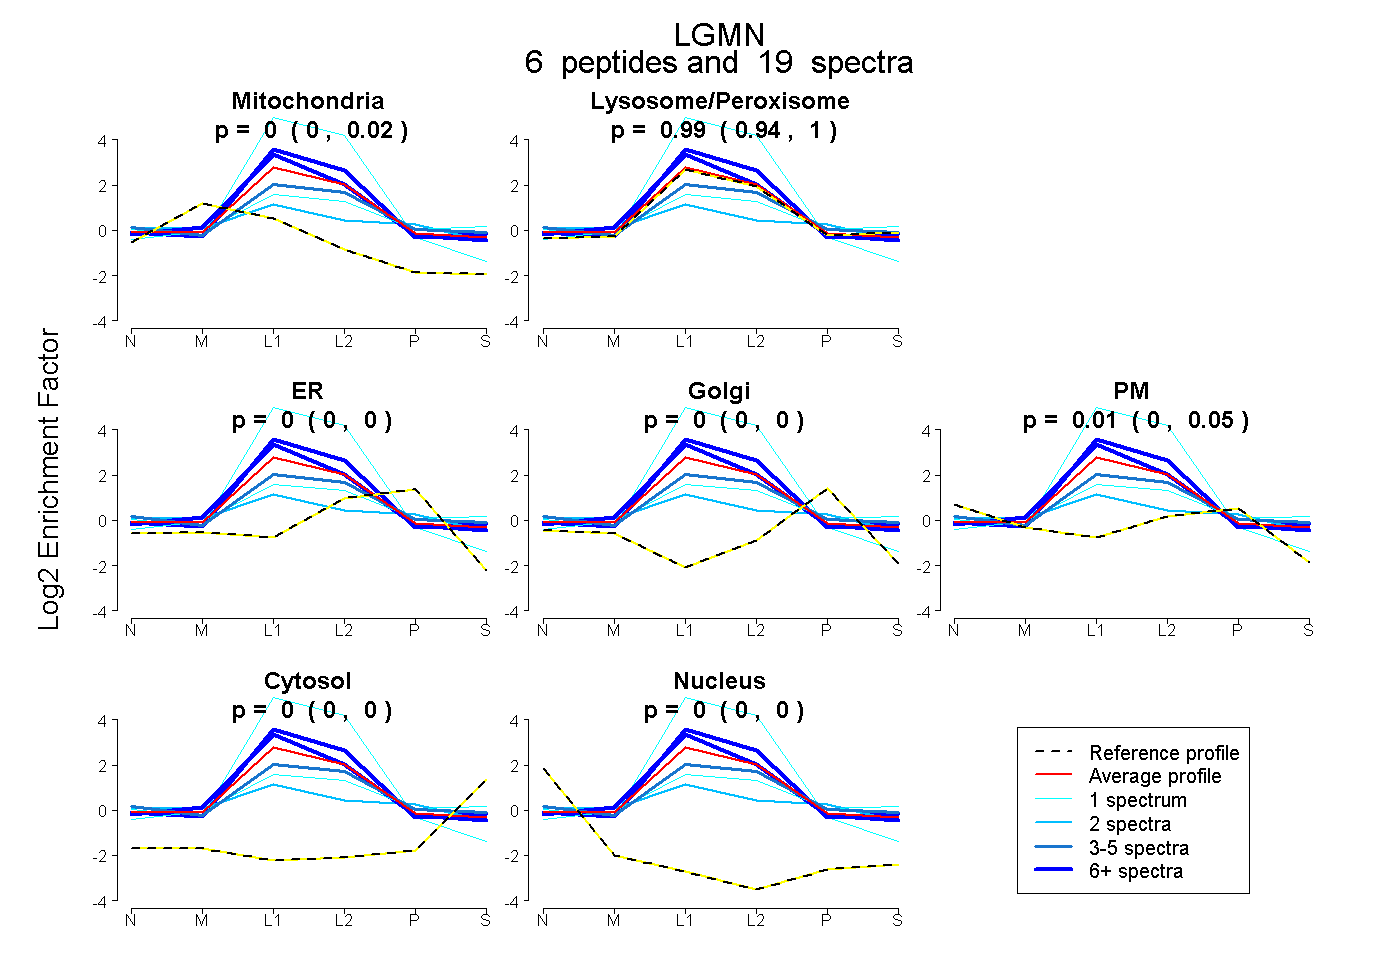
0.000 | 0.015
0.937 | 1.000
0.000 | 0.000
0.000 | 0.000
0.000 | 0.049
0.000 | 0.000
0.000 | 0.000
7peptides
spectra
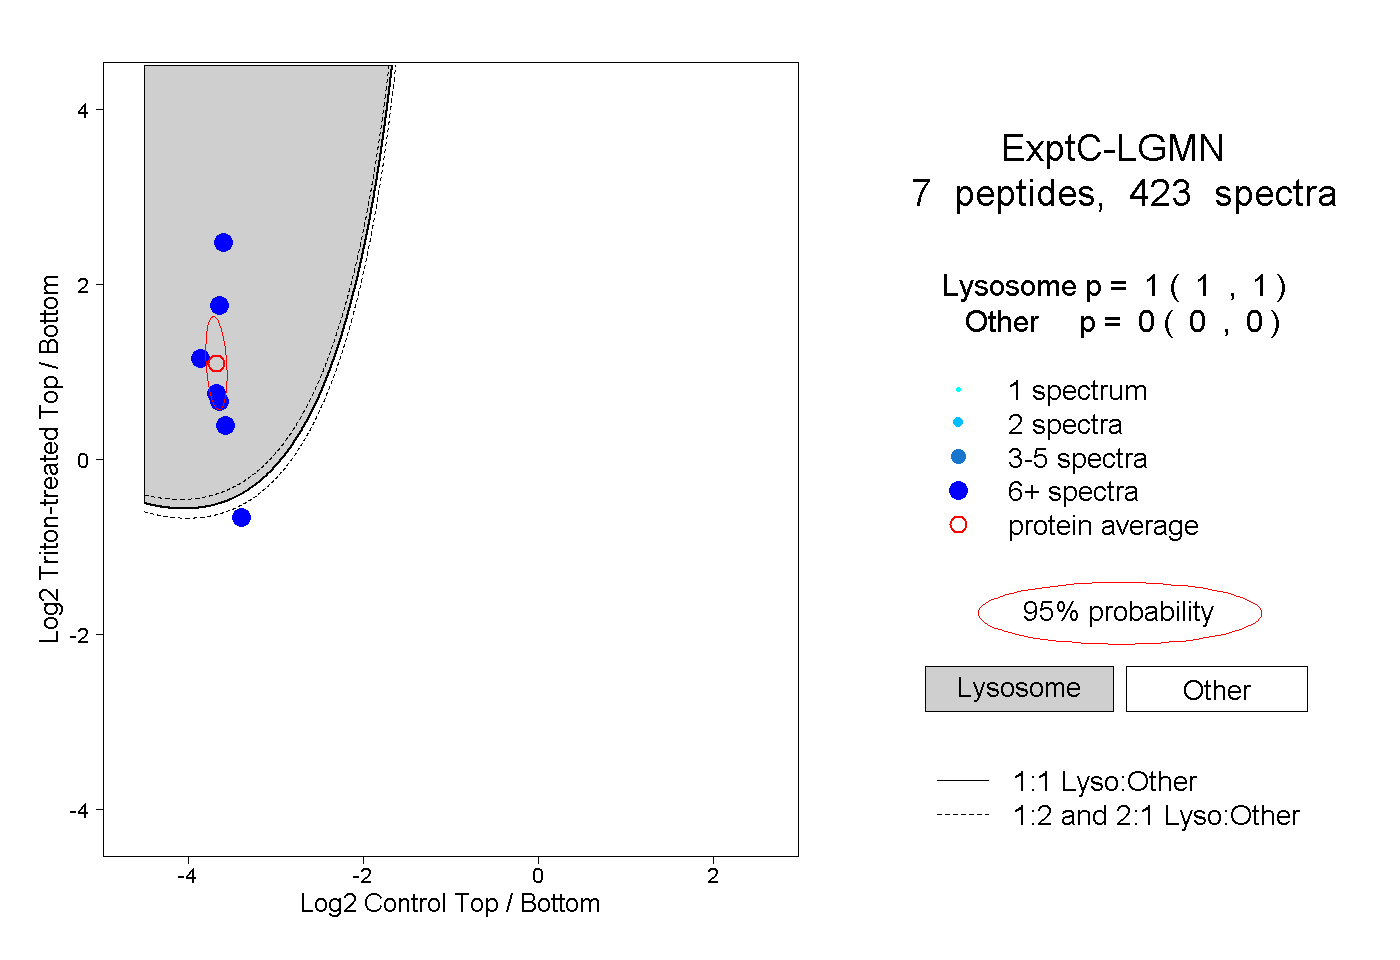
1.000 | 1.000
0.000 | 0.000
4peptides
spectra
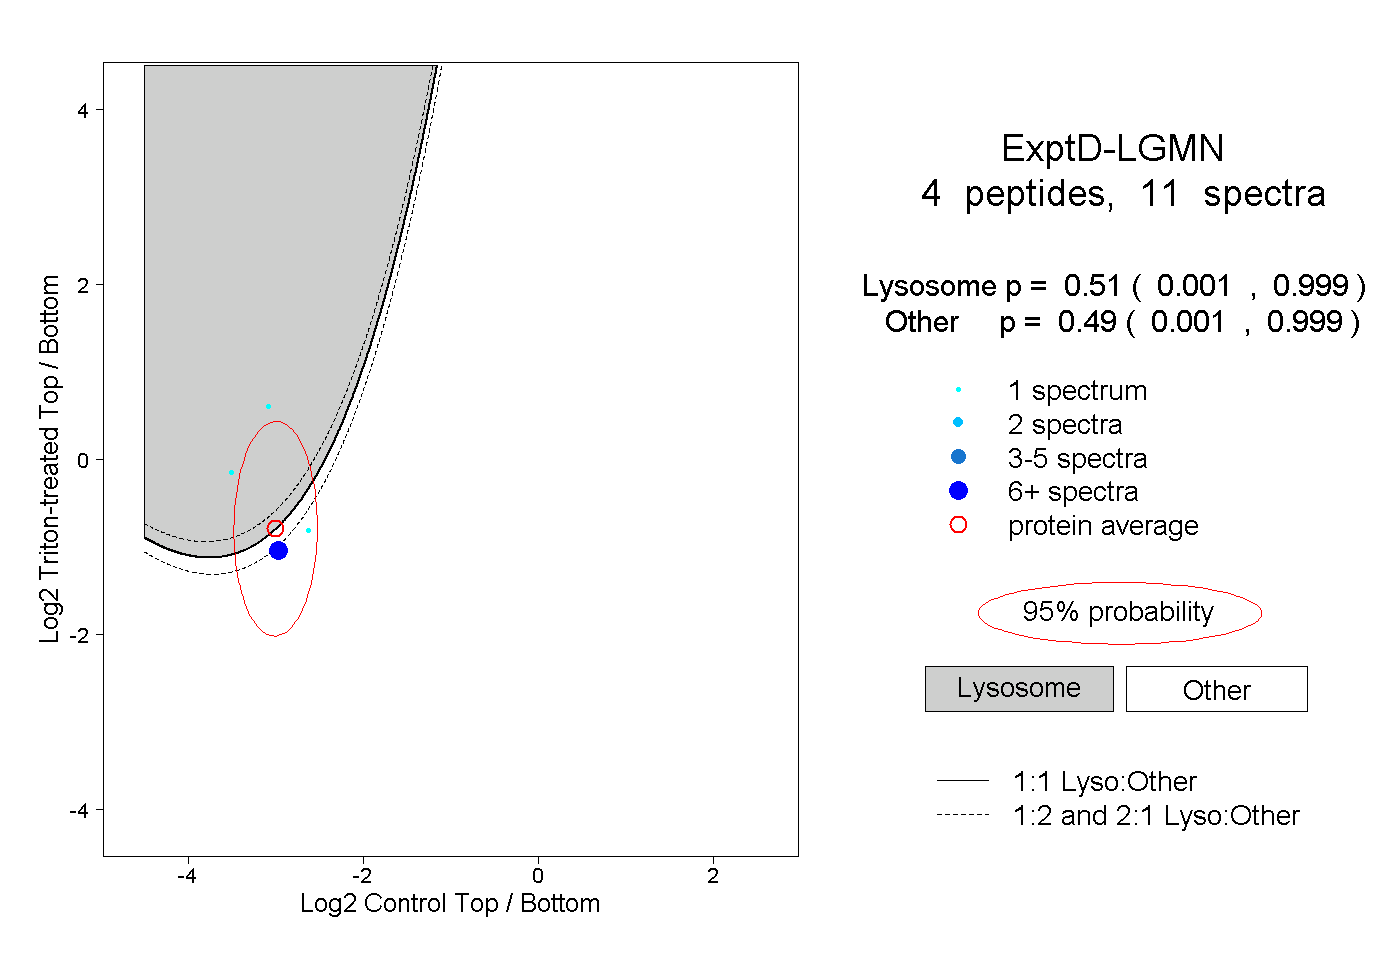
0.001 | 0.999
0.001 | 0.999