 7
7peptides
spectra
0.000 | 0.000
0.988 | 1.000
0.000 | 0.000
0.000 | 0.000
0.000 | 0.000
0.000 | 0.000
0.000 | 0.010
0.000 | 0.000
| Plot | Mito | Lyso | Perox | ER | Golgi | PM | Cytosol | Nucleus | |||||
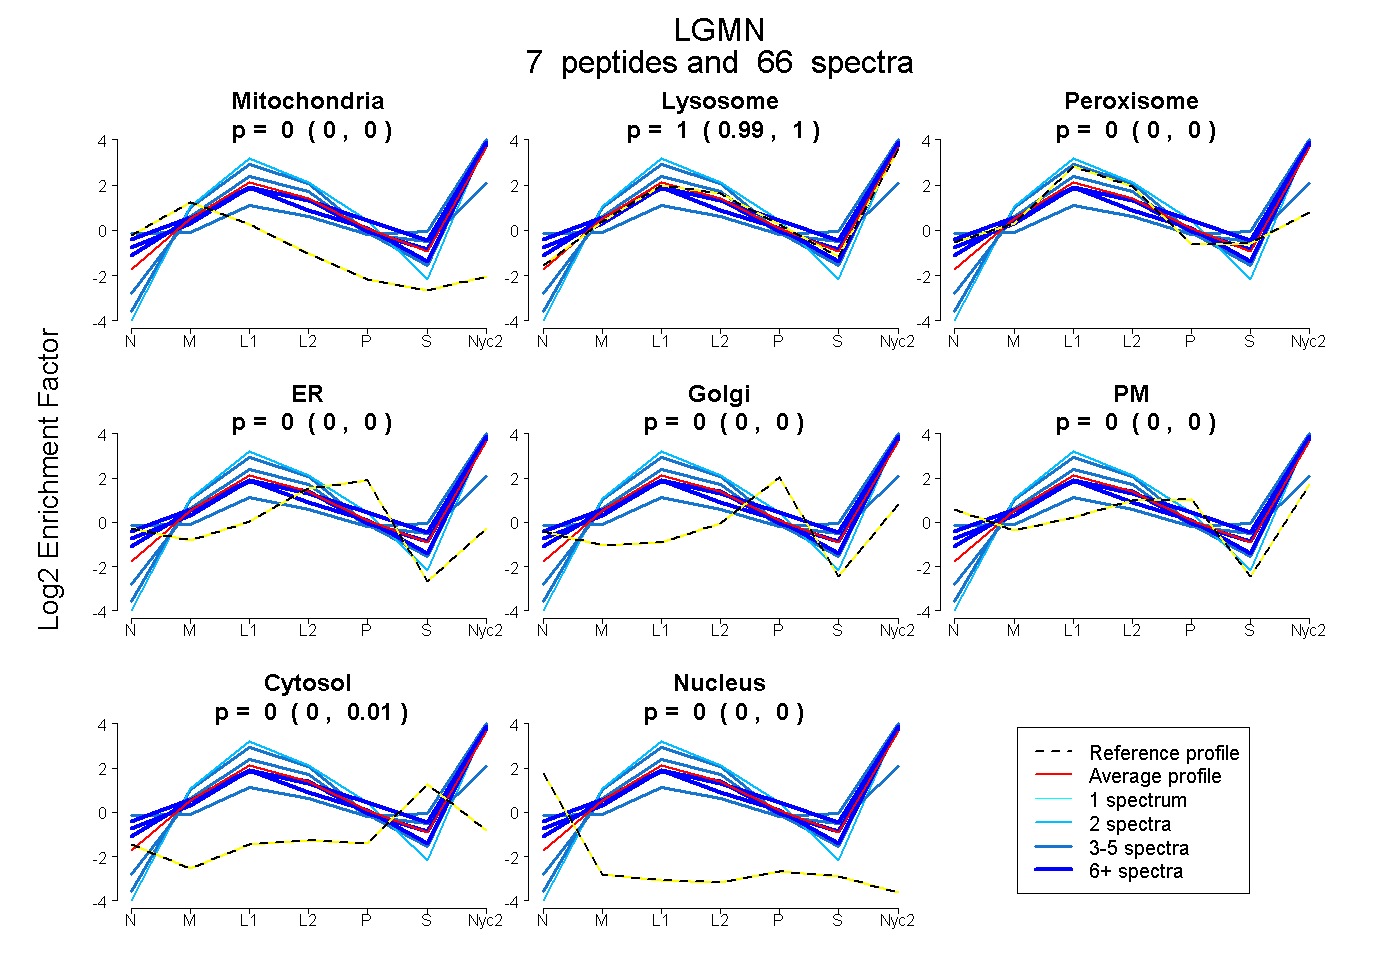
| Expt A |
7 peptides |
66 spectra |
|
0.000 0.000 | 0.000 |
0.996 0.988 | 1.000 |
0.000 0.000 | 0.000 |
0.000 0.000 | 0.000 |
0.000 0.000 | 0.000 |
0.000 0.000 | 0.000 |
0.004 0.000 | 0.010 |
0.000 0.000 | 0.000 |
| 20 spectra, QYHLVK | 0.000 | 0.832 | 0.000 | 0.000 | 0.000 | 0.168 | 0.000 | 0.000 | ||
| 5 spectra, HQADACHAYQIIHR | 0.000 | 0.384 | 0.194 | 0.000 | 0.000 | 0.235 | 0.175 | 0.013 | ||
| 3 spectra, DYTGEDVTPENFLAVLR | 0.000 | 1.000 | 0.000 | 0.000 | 0.000 | 0.000 | 0.000 | 0.000 | ||
| 13 spectra, YMYEHK | 0.000 | 0.947 | 0.000 | 0.000 | 0.000 | 0.034 | 0.018 | 0.000 | ||
| 2 spectra, GDEEAVK | 0.000 | 1.000 | 0.000 | 0.000 | 0.000 | 0.000 | 0.000 | 0.000 | ||
| 19 spectra, VMQFQGMK | 0.000 | 0.985 | 0.000 | 0.000 | 0.000 | 0.000 | 0.006 | 0.009 | ||
| 4 spectra, SISTMK | 0.000 | 1.000 | 0.000 | 0.000 | 0.000 | 0.000 | 0.000 | 0.000 |
| Plot | Mito | Lyso or Perox | ER | Golgi | PM | Cytosol | Nucleus | ||||||
| Expt B |
6 peptides |
19 spectra |
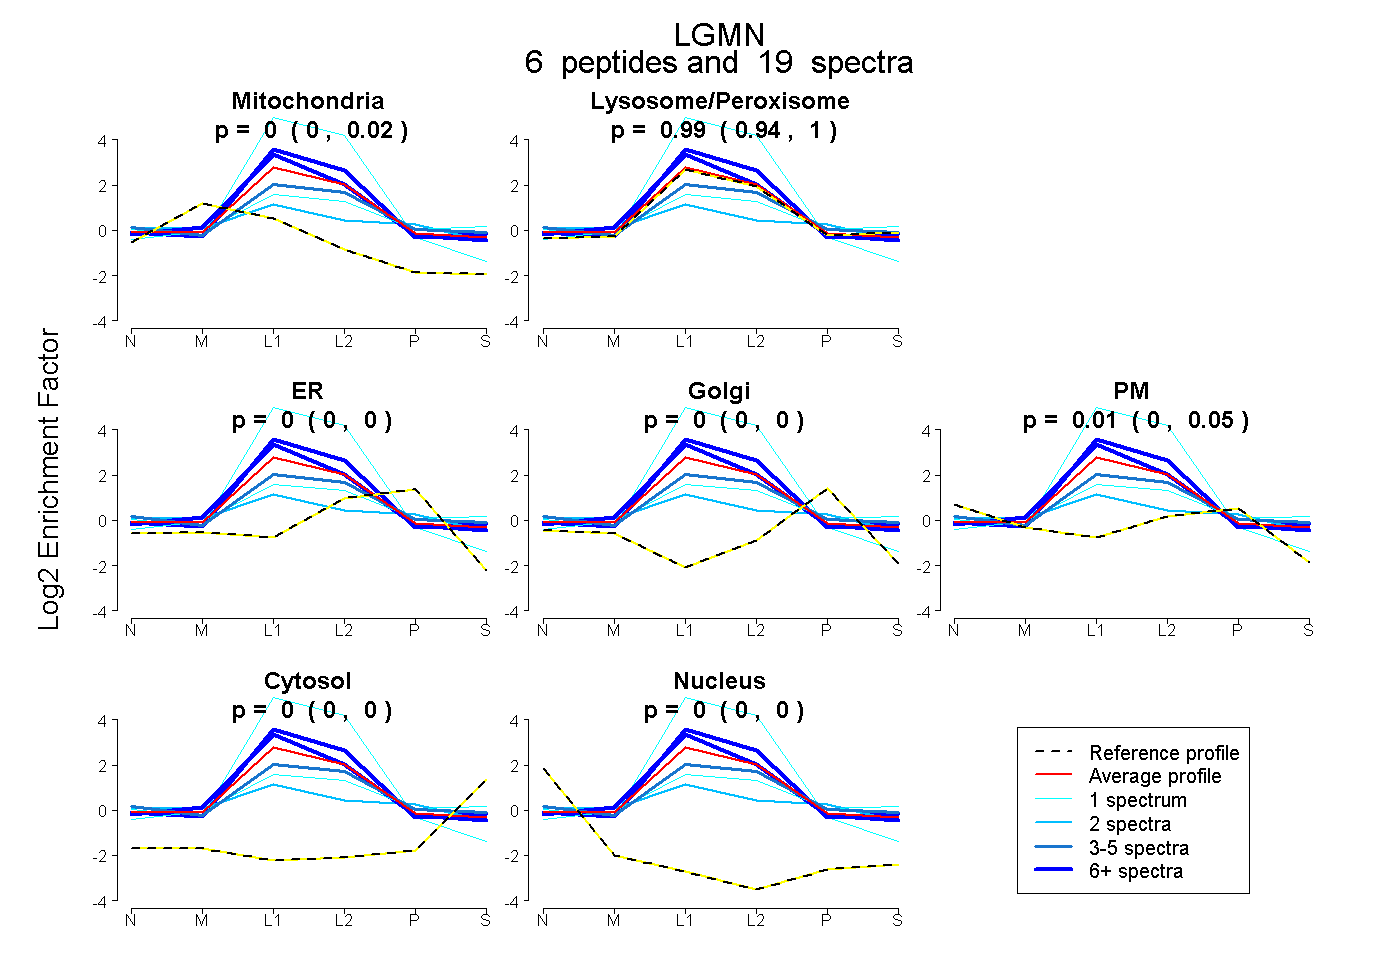 |
0.000 0.000 | 0.015 |
0.986 0.937 | 1.000 |
0.000 0.000 | 0.000 |
0.000 0.000 | 0.000 |
0.014 0.000 | 0.049 |
0.000 0.000 | 0.000 |
0.000 0.000 | 0.000 |
|||
| Plot | Lyso | Other | |||||||||||
| Expt C |
7 peptides |
423 spectra |
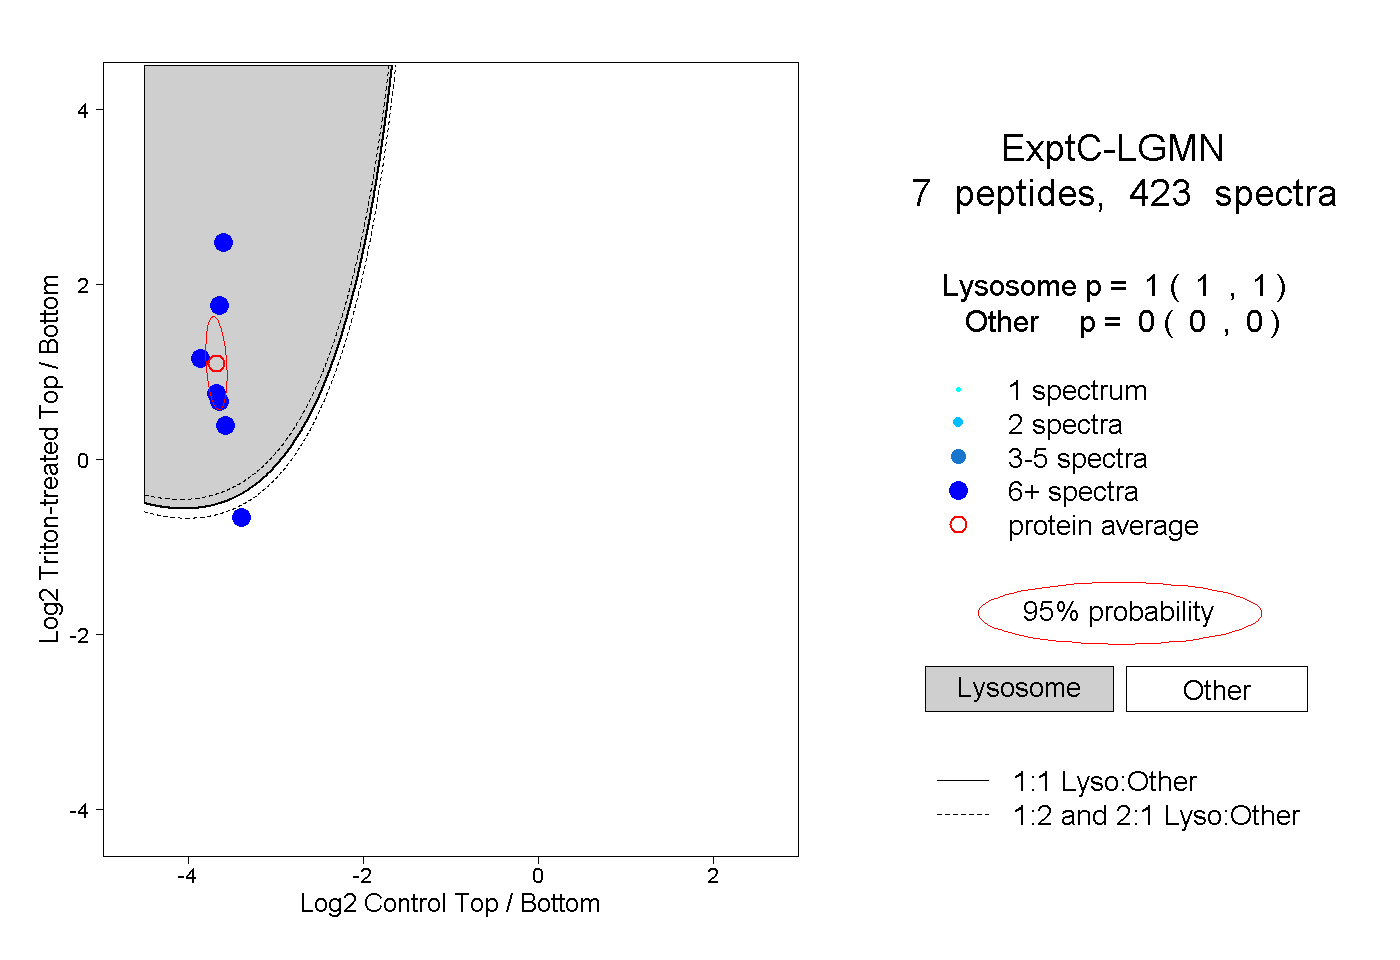 |
1.000 1.000 | 1.000 |
0.000 0.000 | 0.000 |
||||||||
| Plot | Lyso | Other | |||||||||||
| Expt D |
4 peptides |
11 spectra |
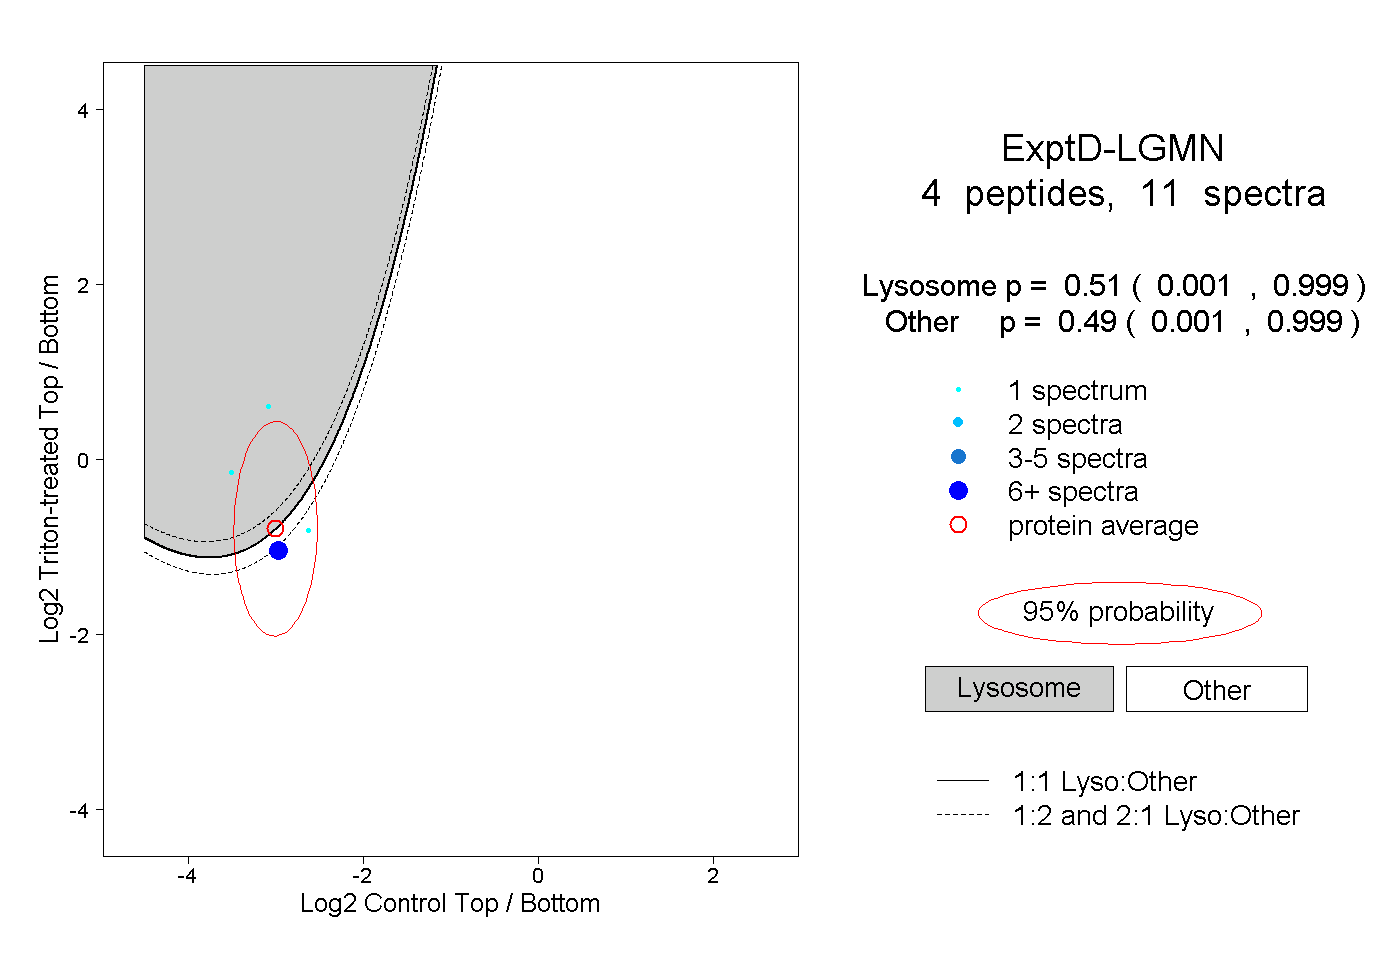 |
0.510 0.001 | 0.999 |
0.490 0.001 | 0.999 |