 3
3peptides
spectra
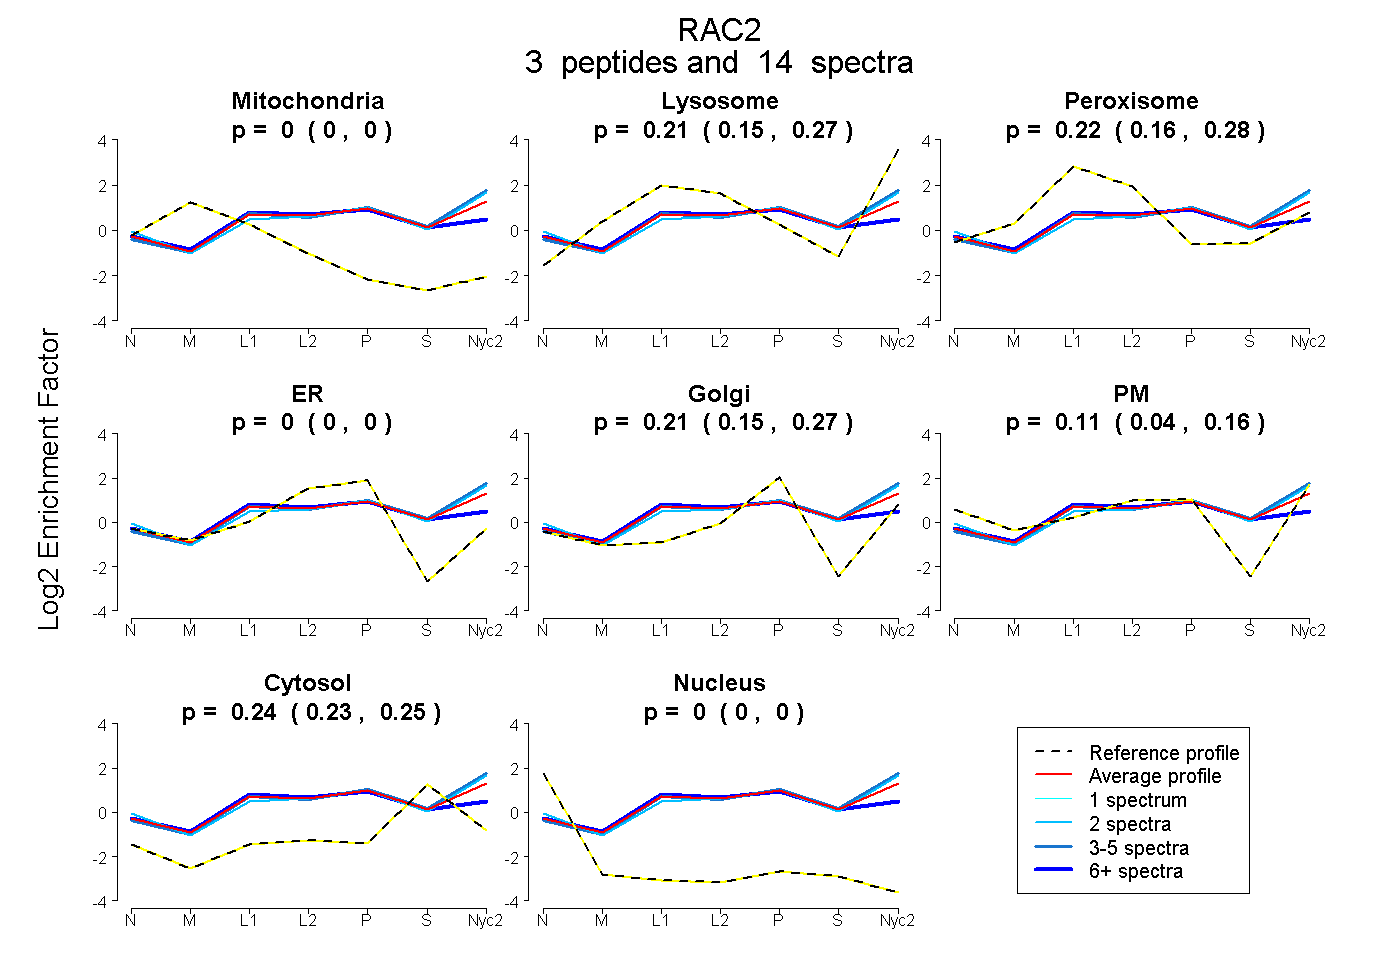
0.000 | 0.000
0.153 | 0.270
0.155 | 0.281
0.000 | 0.000
0.153 | 0.266
0.041 | 0.158
0.230 | 0.251
0.000 | 0.000
1peptide
spectrum
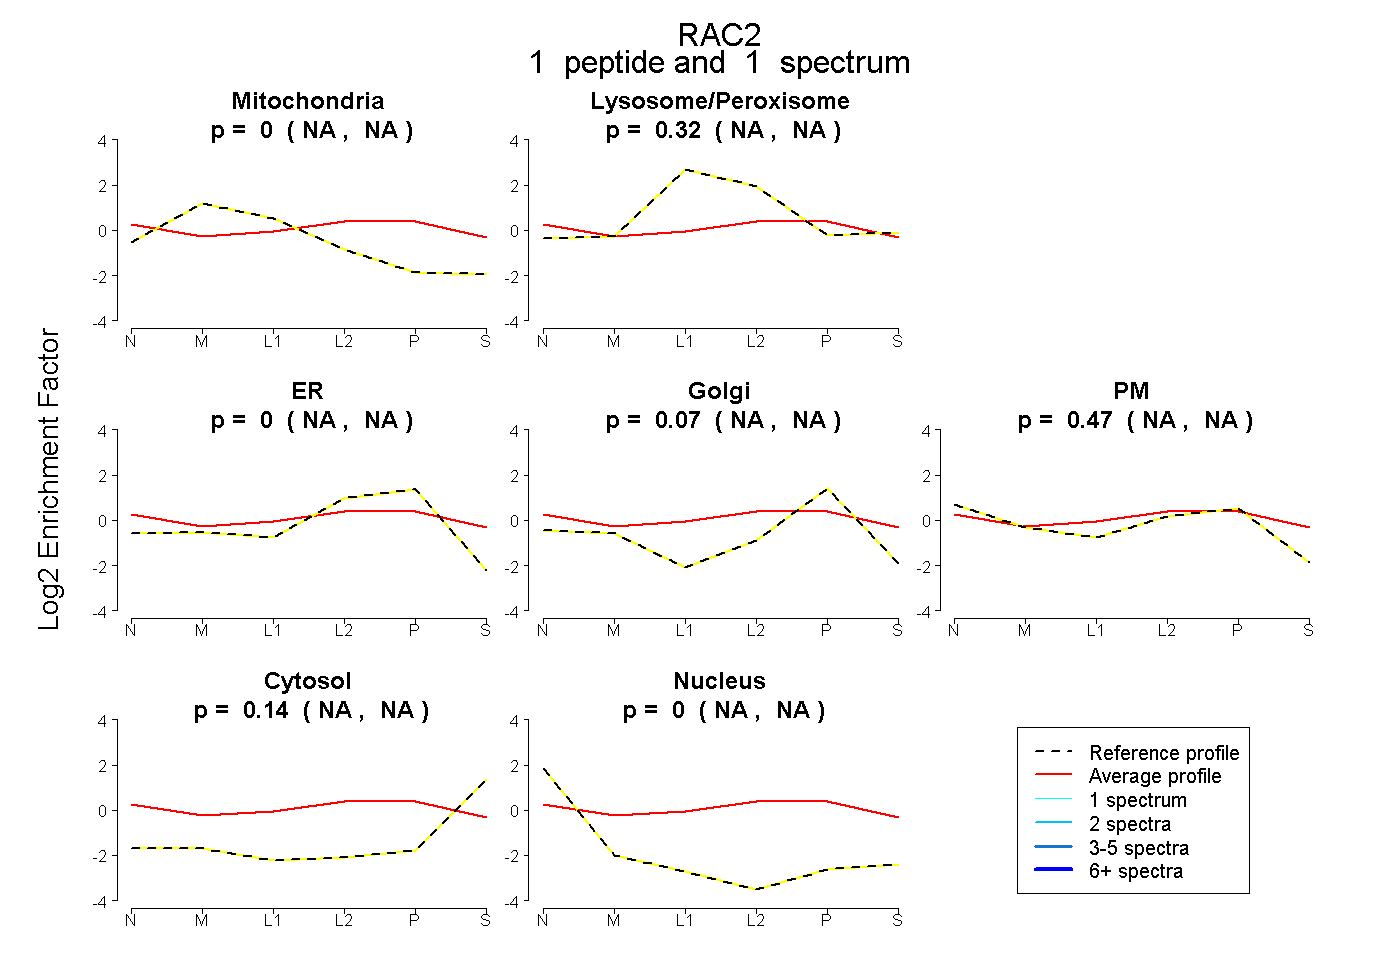
NA | NA
NA | NA
NA | NA
NA | NA
NA | NA
NA | NA
NA | NA
3peptides
spectra
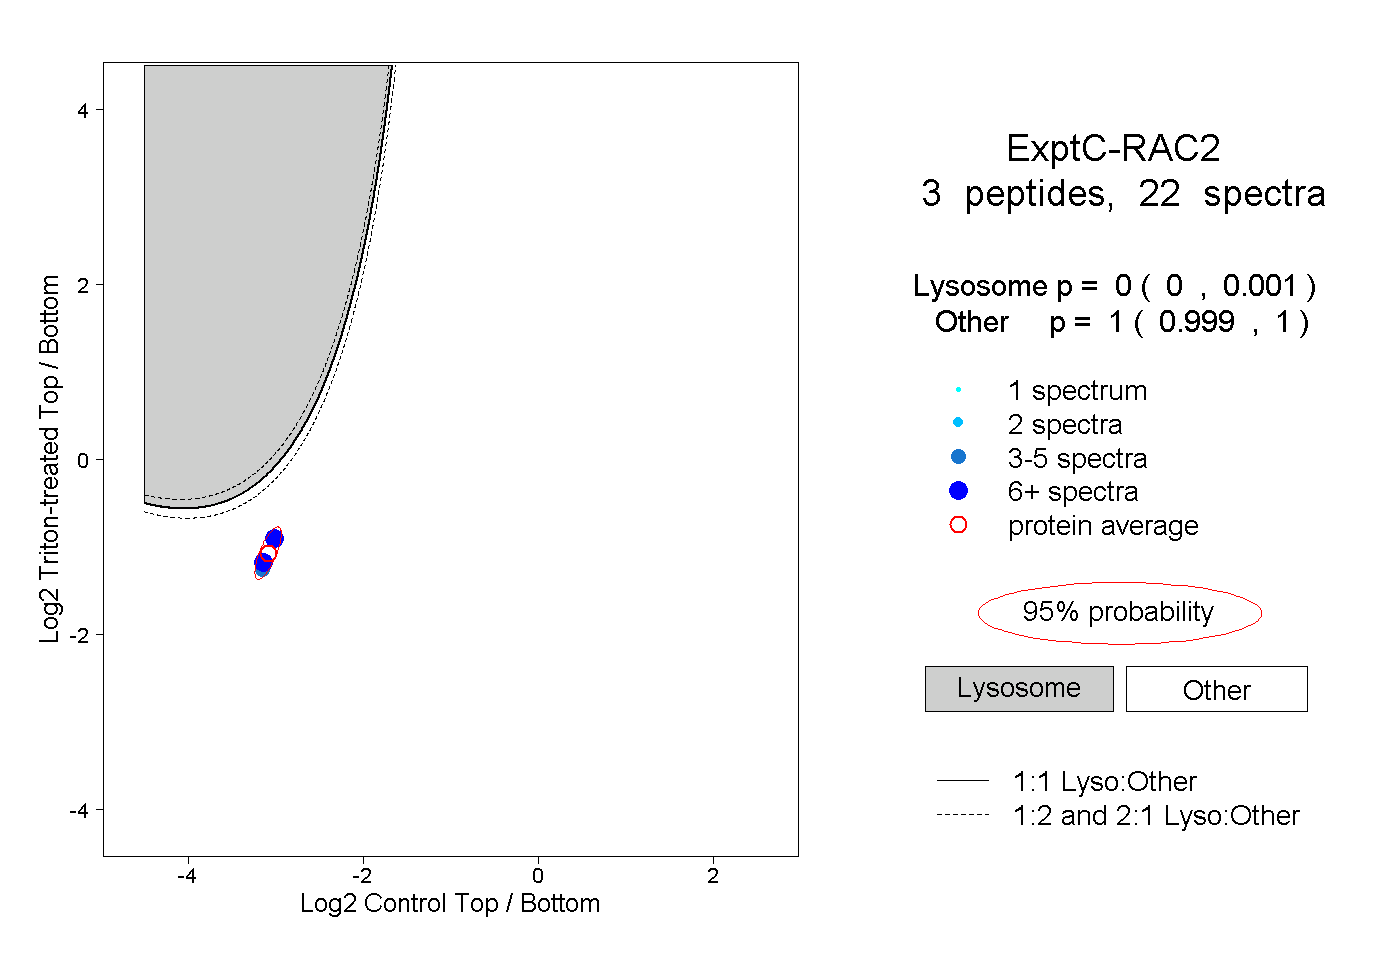
0.000 | 0.001
0.999 | 1.000
5peptides
spectra
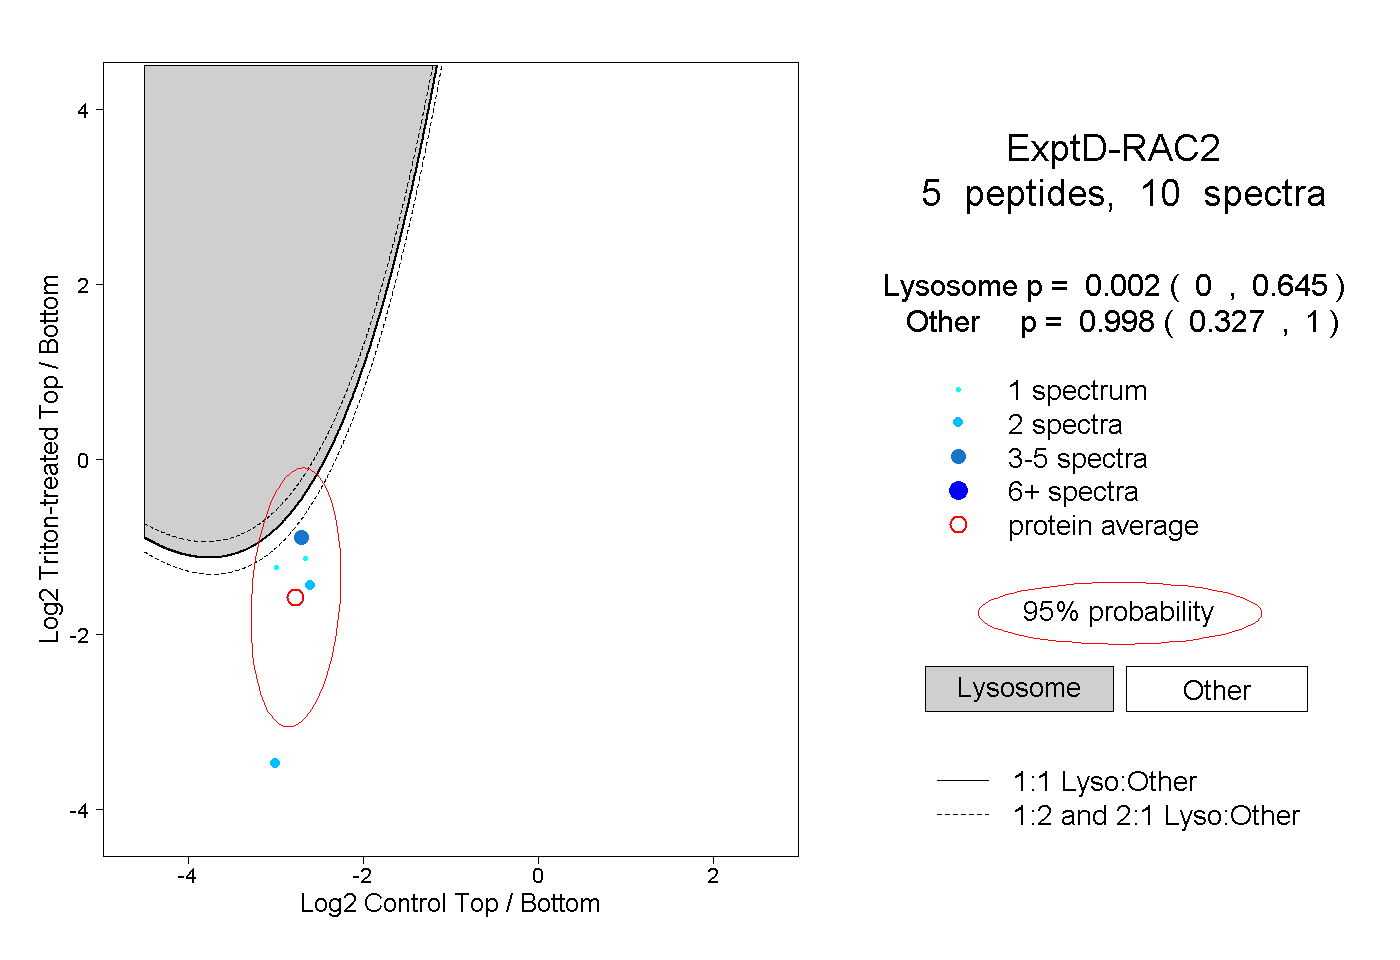
0.000 | 0.645
0.327 | 1.000