 3
3peptides
spectra
0.000 | 0.000
0.153 | 0.270
0.155 | 0.281
0.000 | 0.000
0.153 | 0.266
0.041 | 0.158
0.230 | 0.251
0.000 | 0.000
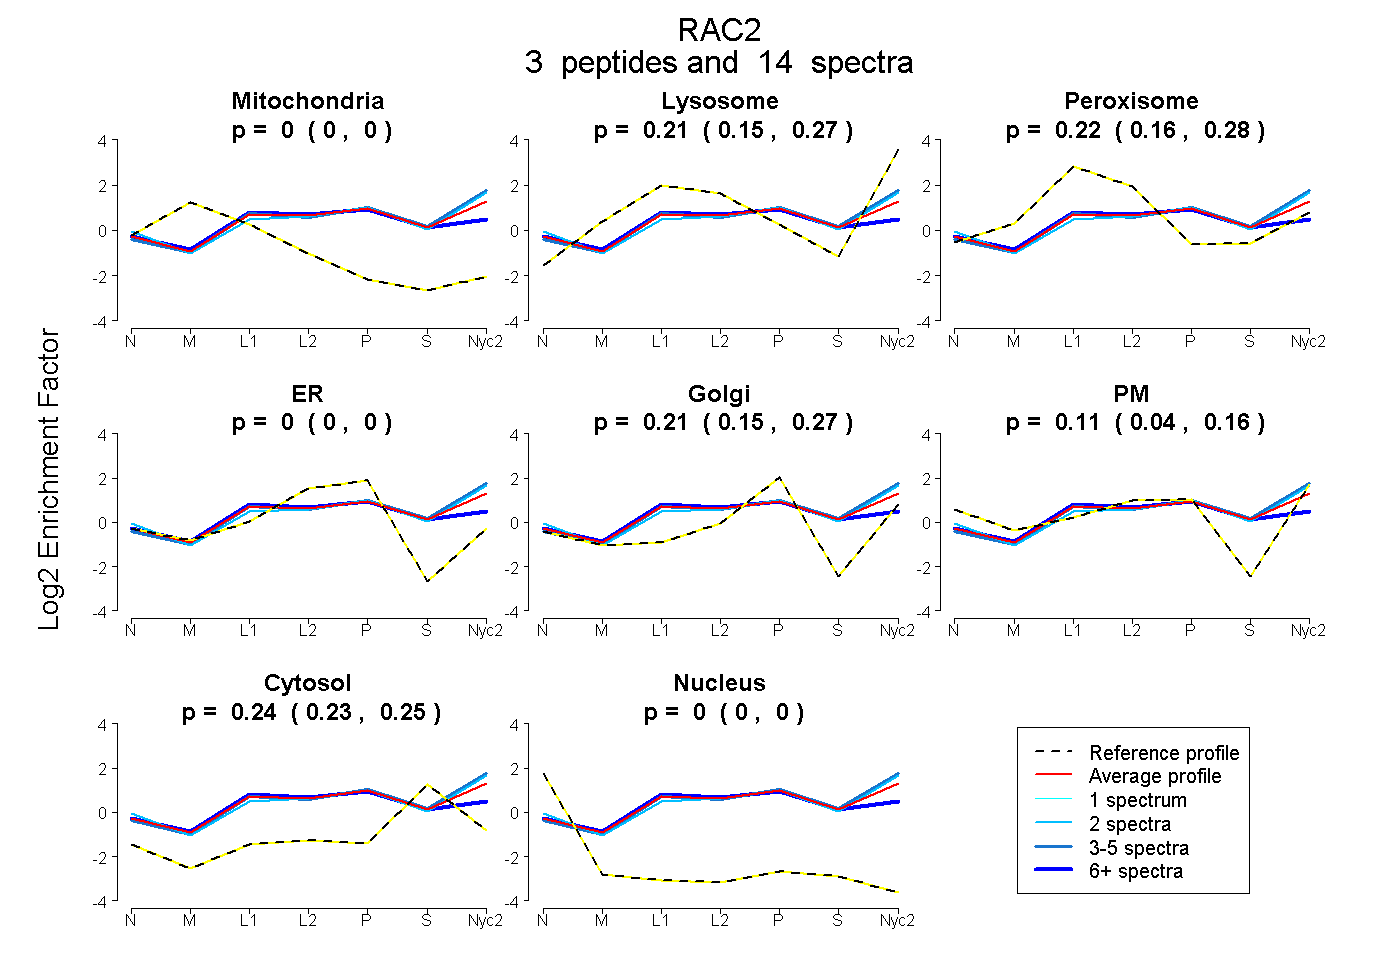
| Plot | Mito | Lyso | Perox | ER | Golgi | PM | Cytosol | Nucleus | |||||
| Expt A |
3 peptides |
14 spectra |
|
0.000 0.000 | 0.000 |
0.215 0.153 | 0.270 |
0.225 0.155 | 0.281 |
0.000 0.000 | 0.000 |
0.213 0.153 | 0.266 |
0.106 0.041 | 0.158 |
0.241 0.230 | 0.251 |
0.000 0.000 | 0.000 |
| 8 spectra, AVLCPQPTR | 0.000 | 0.000 | 0.454 | 0.000 | 0.329 | 0.000 | 0.217 | 0.000 | ||
| 2 spectra, WFPEVR | 0.000 | 0.278 | 0.035 | 0.000 | 0.031 | 0.376 | 0.280 | 0.000 | ||
| 4 spectra, DIDSVK | 0.000 | 0.376 | 0.085 | 0.000 | 0.155 | 0.121 | 0.263 | 0.000 |
| Plot | Mito | Lyso or Perox | ER | Golgi | PM | Cytosol | Nucleus | ||||||
| Expt B |
1 peptide |
1 spectrum |
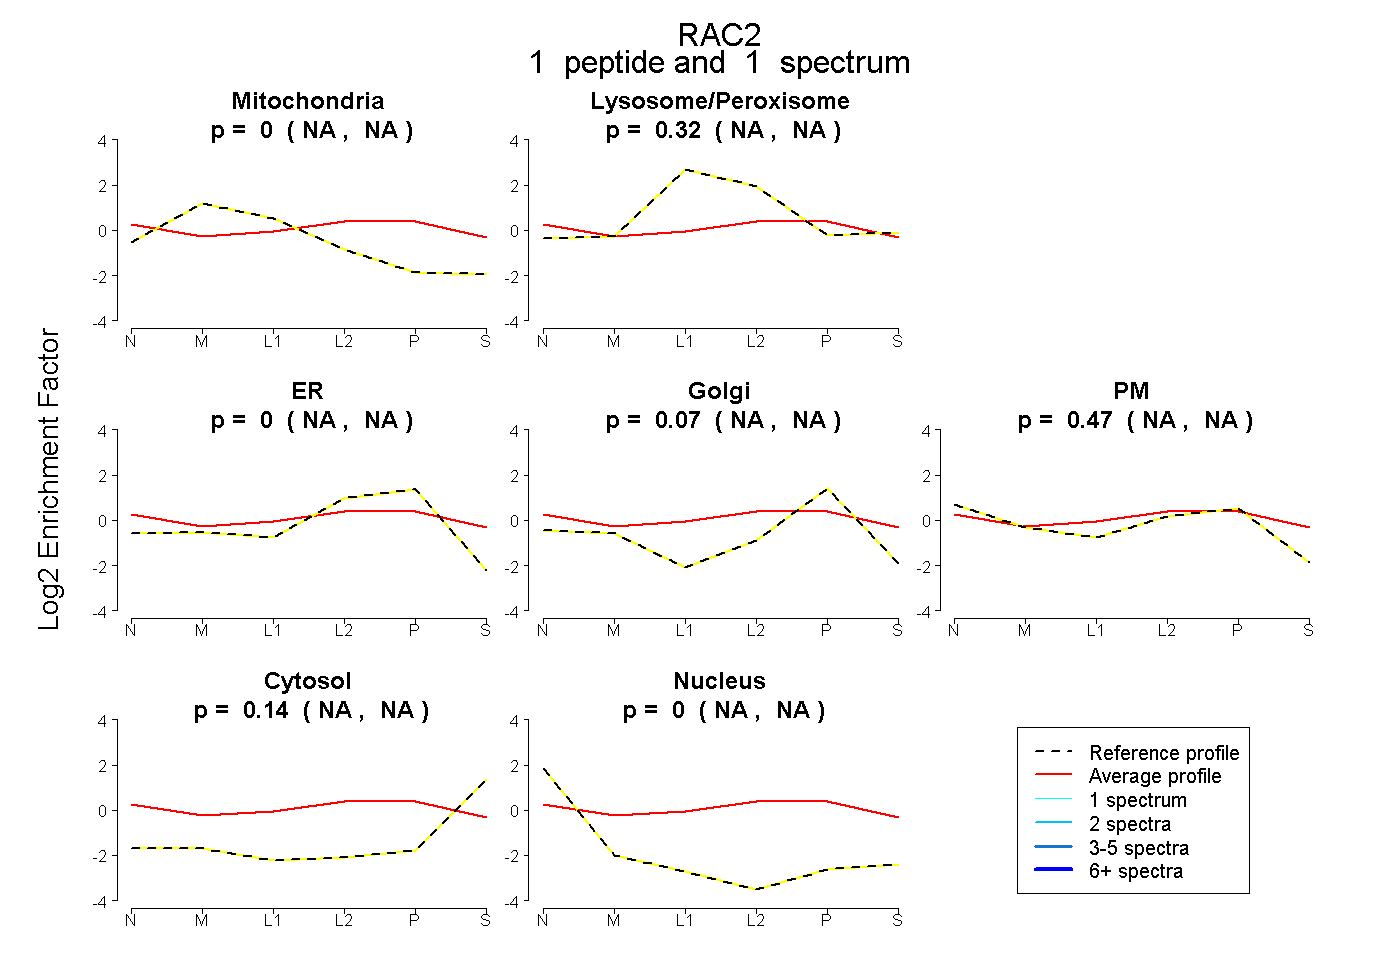 |
0.000 NA | NA |
0.325 NA | NA |
0.000 NA | NA |
0.068 NA | NA |
0.470 NA | NA |
0.137 NA | NA |
0.000 NA | NA |
|||
| Plot | Lyso | Other | |||||||||||
| Expt C |
3 peptides |
22 spectra |
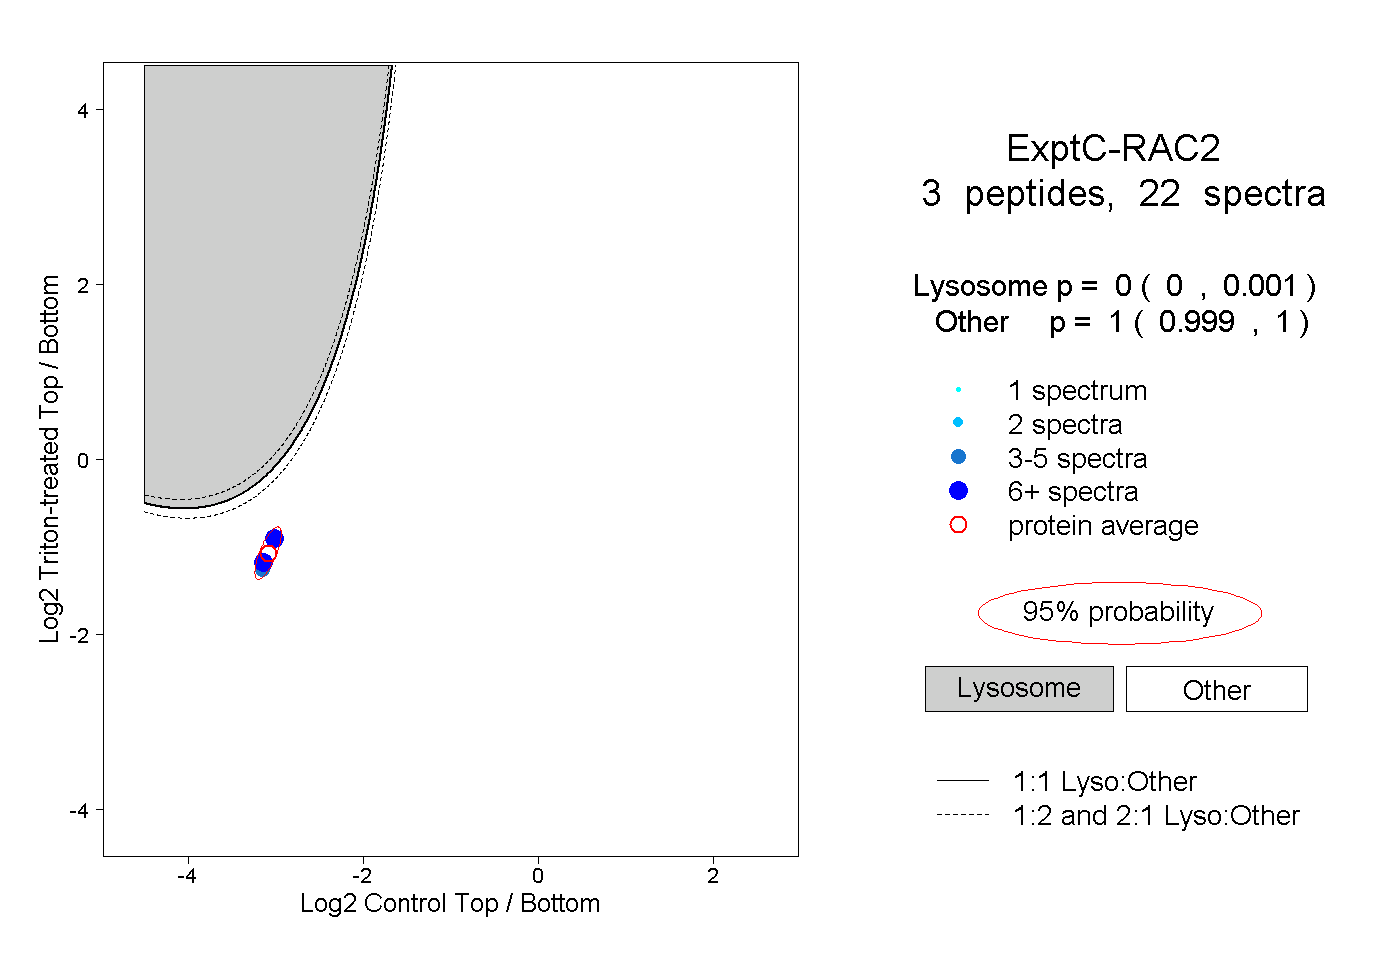 |
0.000 0.000 | 0.001 |
1.000 0.999 | 1.000 |
||||||||
| Plot | Lyso | Other | |||||||||||
| Expt D |
5 peptides |
10 spectra |
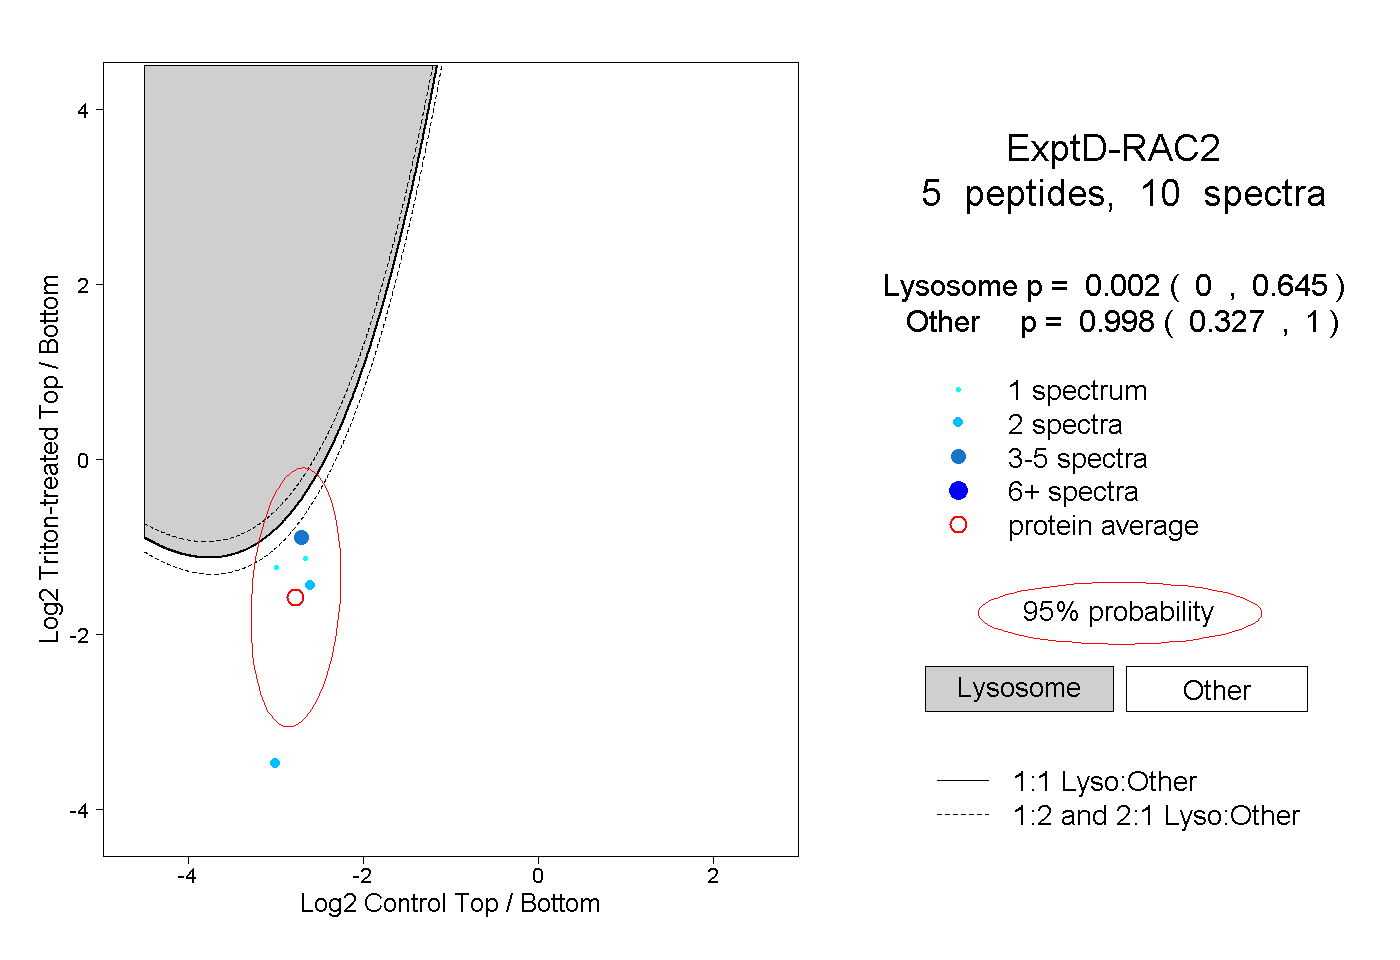 |
0.002 0.000 | 0.645 |
0.998 0.327 | 1.000 |