 3
3peptides
spectra
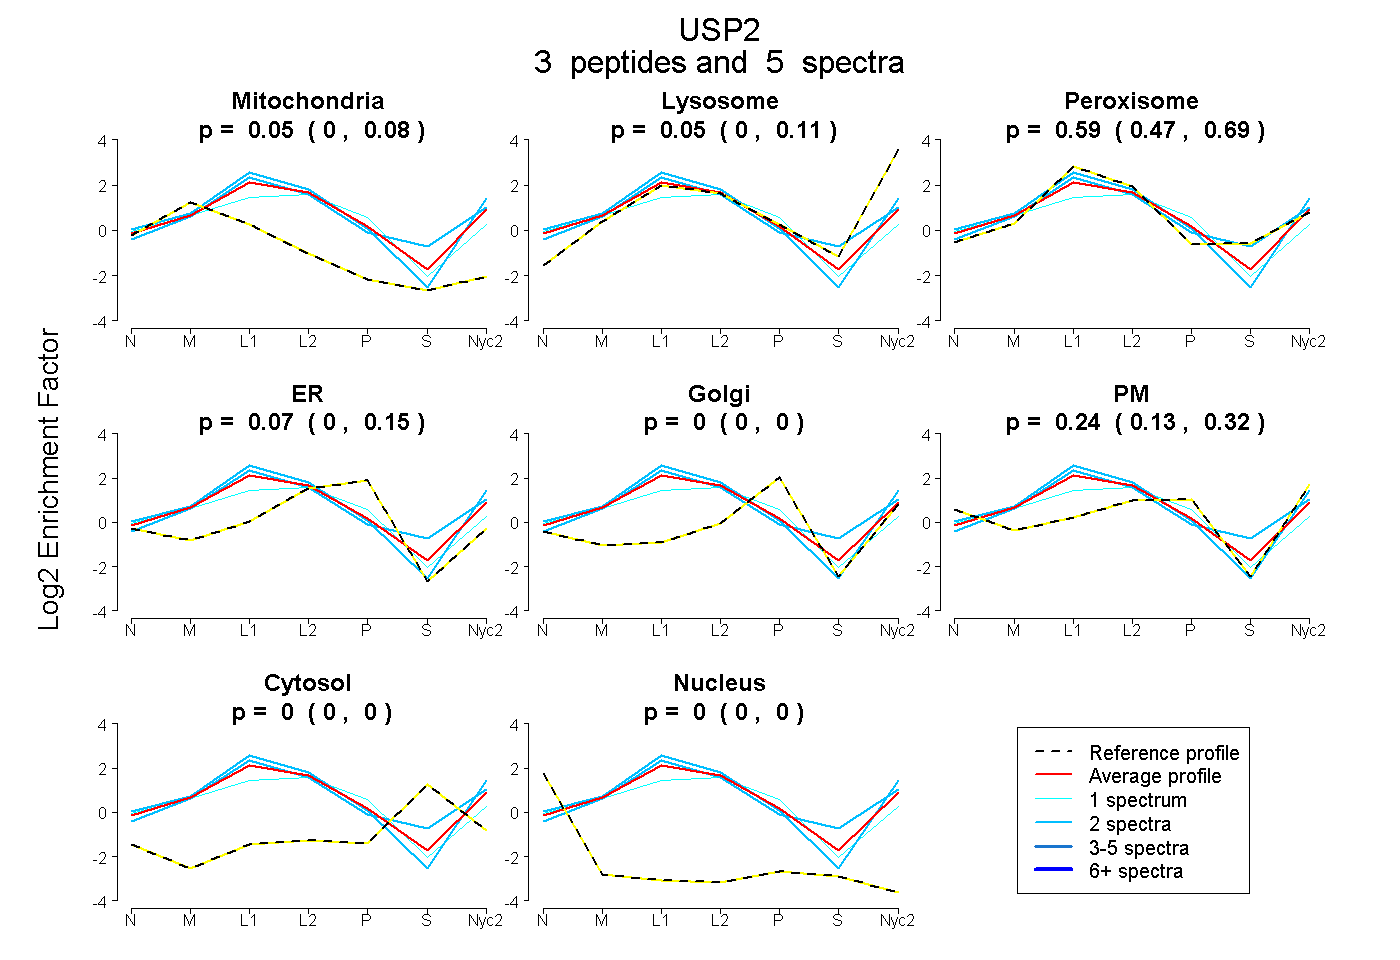
0.002 | 0.084
0.000 | 0.111
0.467 | 0.690
0.000 | 0.150
0.000 | 0.000
0.134 | 0.318
0.000 | 0.000
0.000 | 0.000
2peptides
spectra
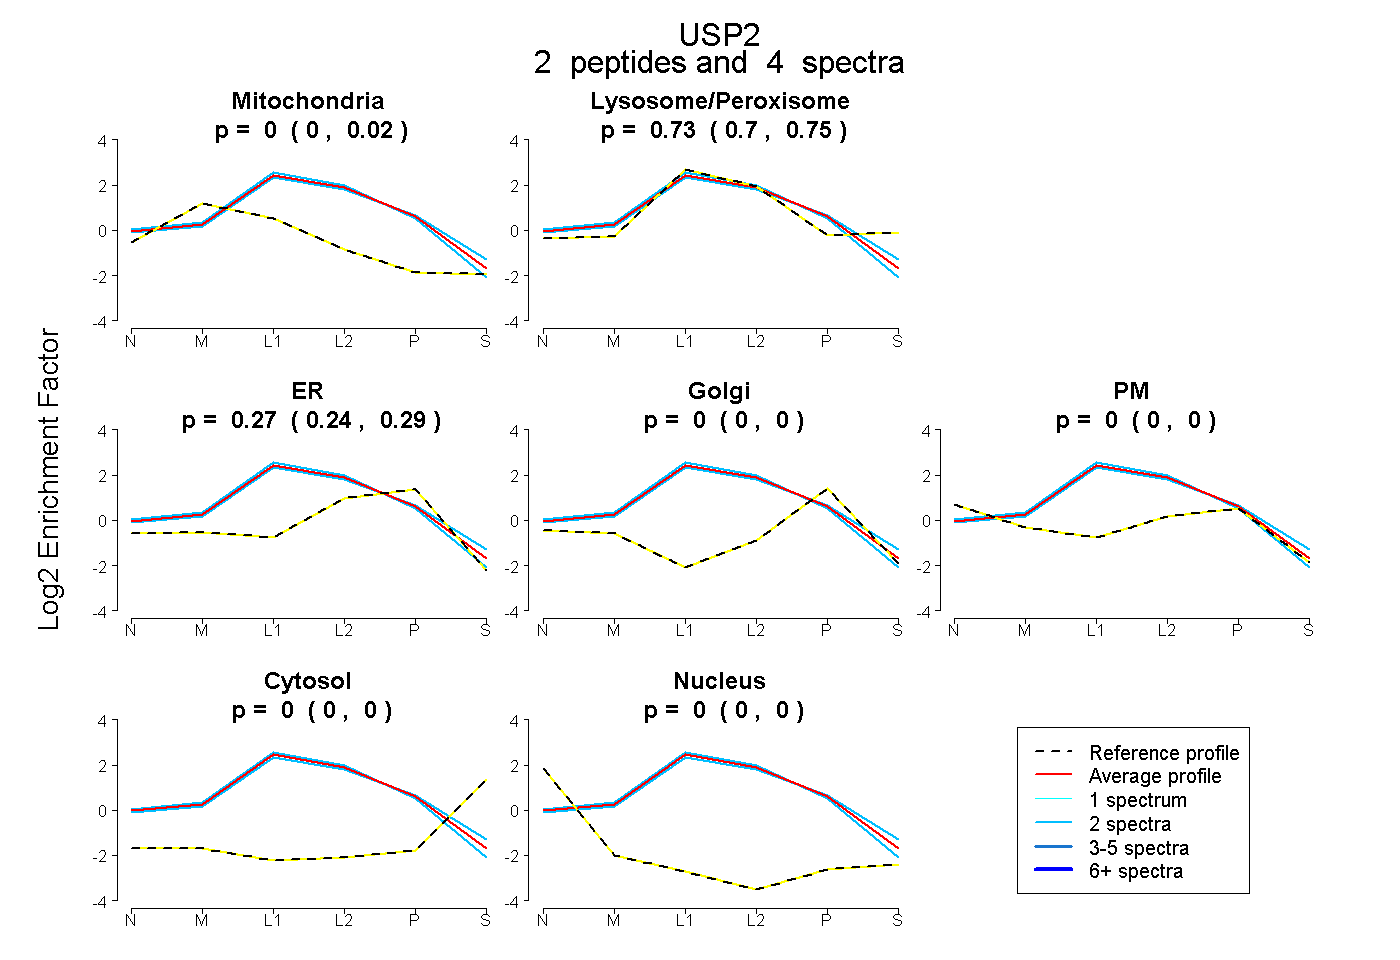
0.000 | 0.016
0.699 | 0.753
0.242 | 0.285
0.000 | 0.000
0.000 | 0.000
0.000 | 0.000
0.000 | 0.000
7peptides
spectra
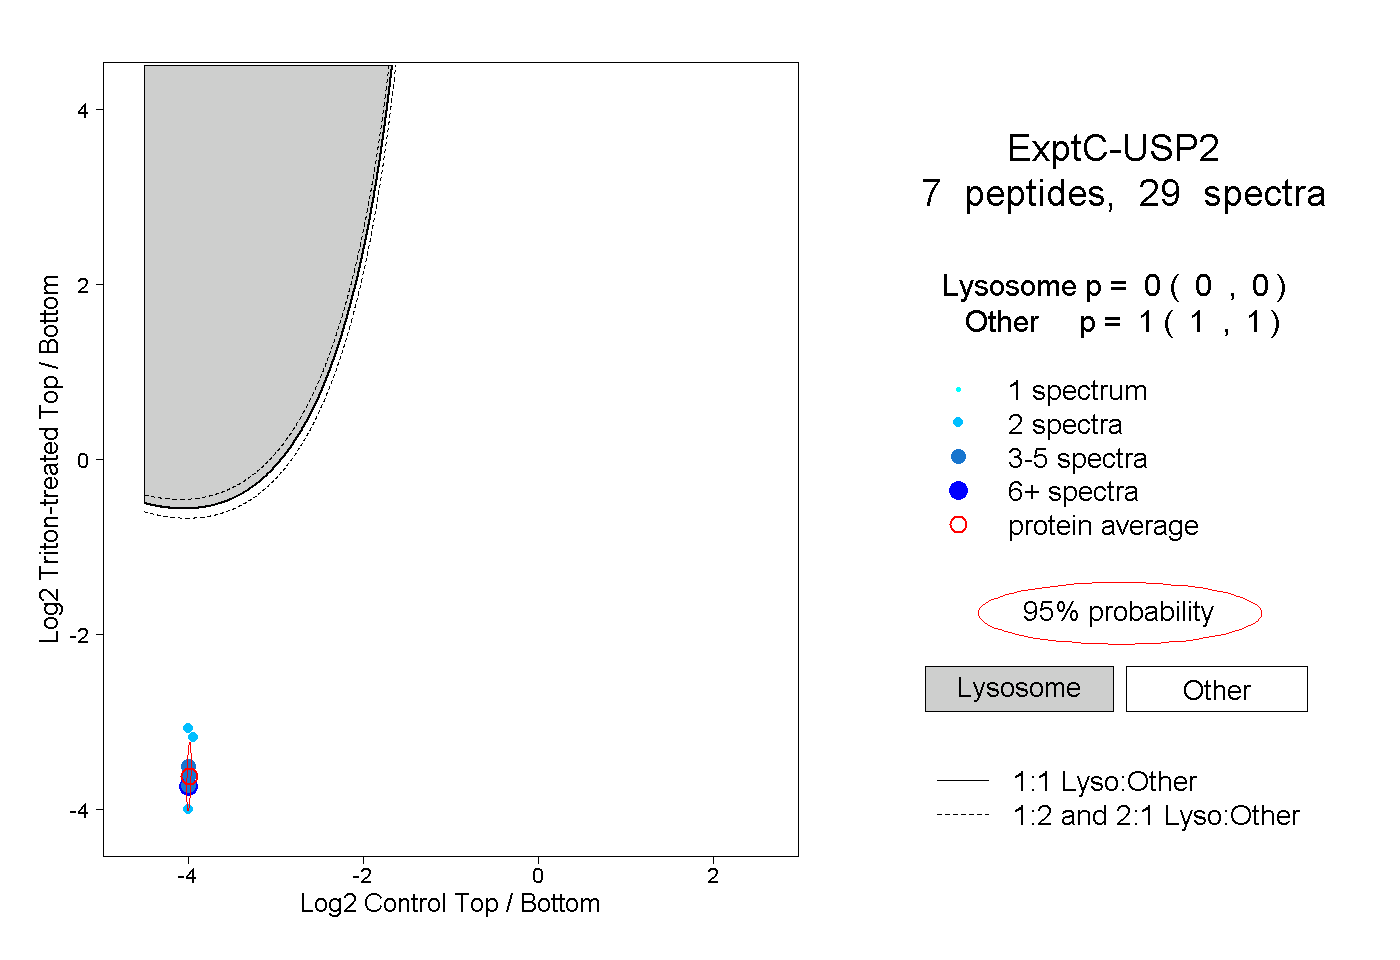
0.000 | 0.000
1.000 | 1.000
1peptide
spectra
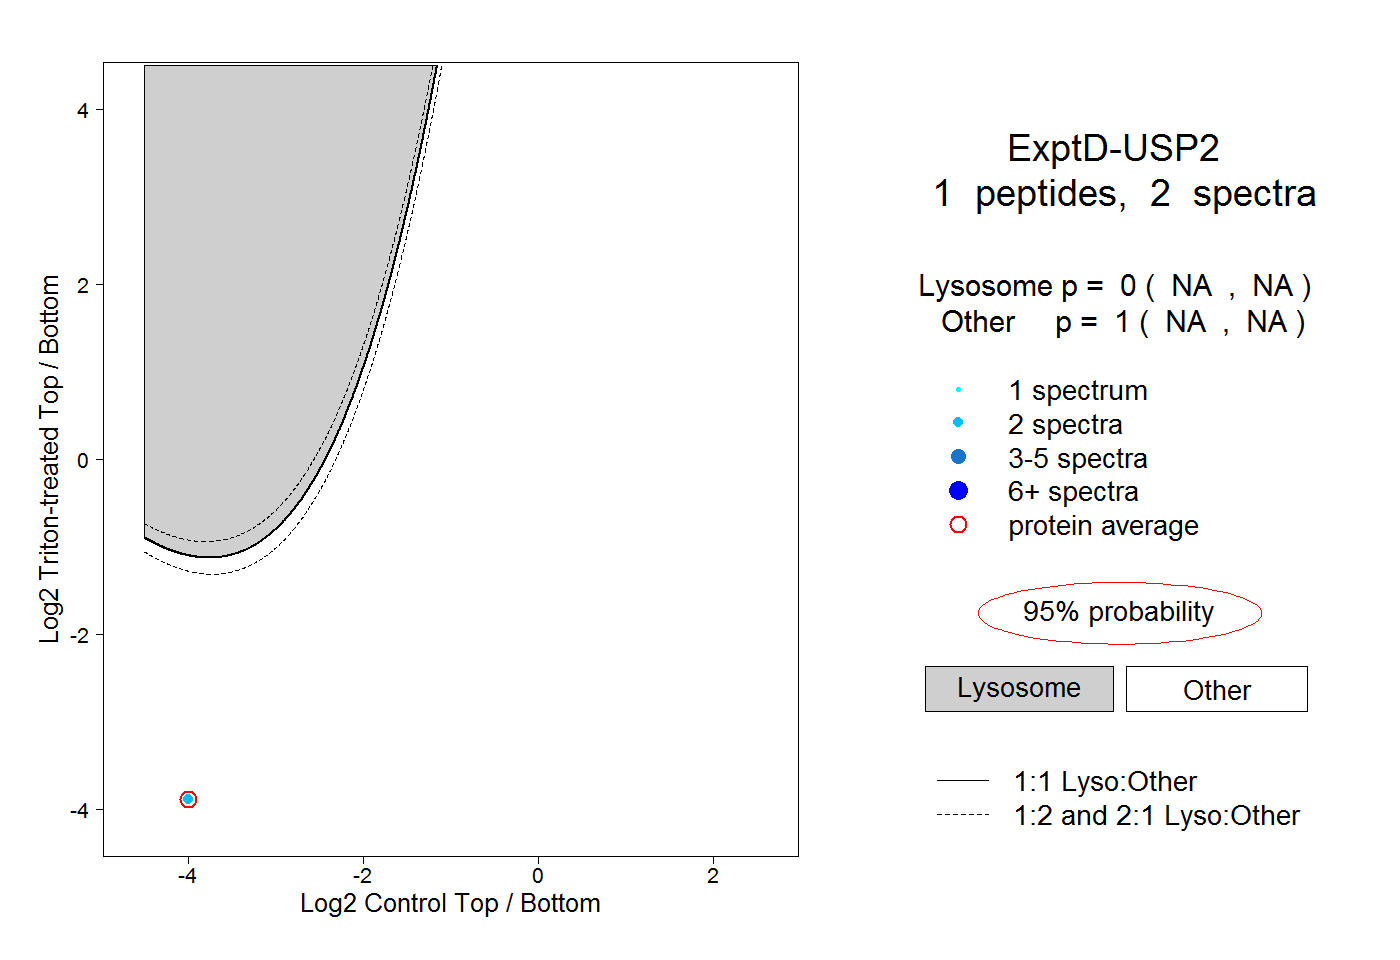
NA | NA
NA | NA