 3
3peptides
spectra
0.002 | 0.084
0.000 | 0.111
0.467 | 0.690
0.000 | 0.150
0.000 | 0.000
0.134 | 0.318
0.000 | 0.000
0.000 | 0.000
| Plot | Mito | Lyso | Perox | ER | Golgi | PM | Cytosol | Nucleus | |||||
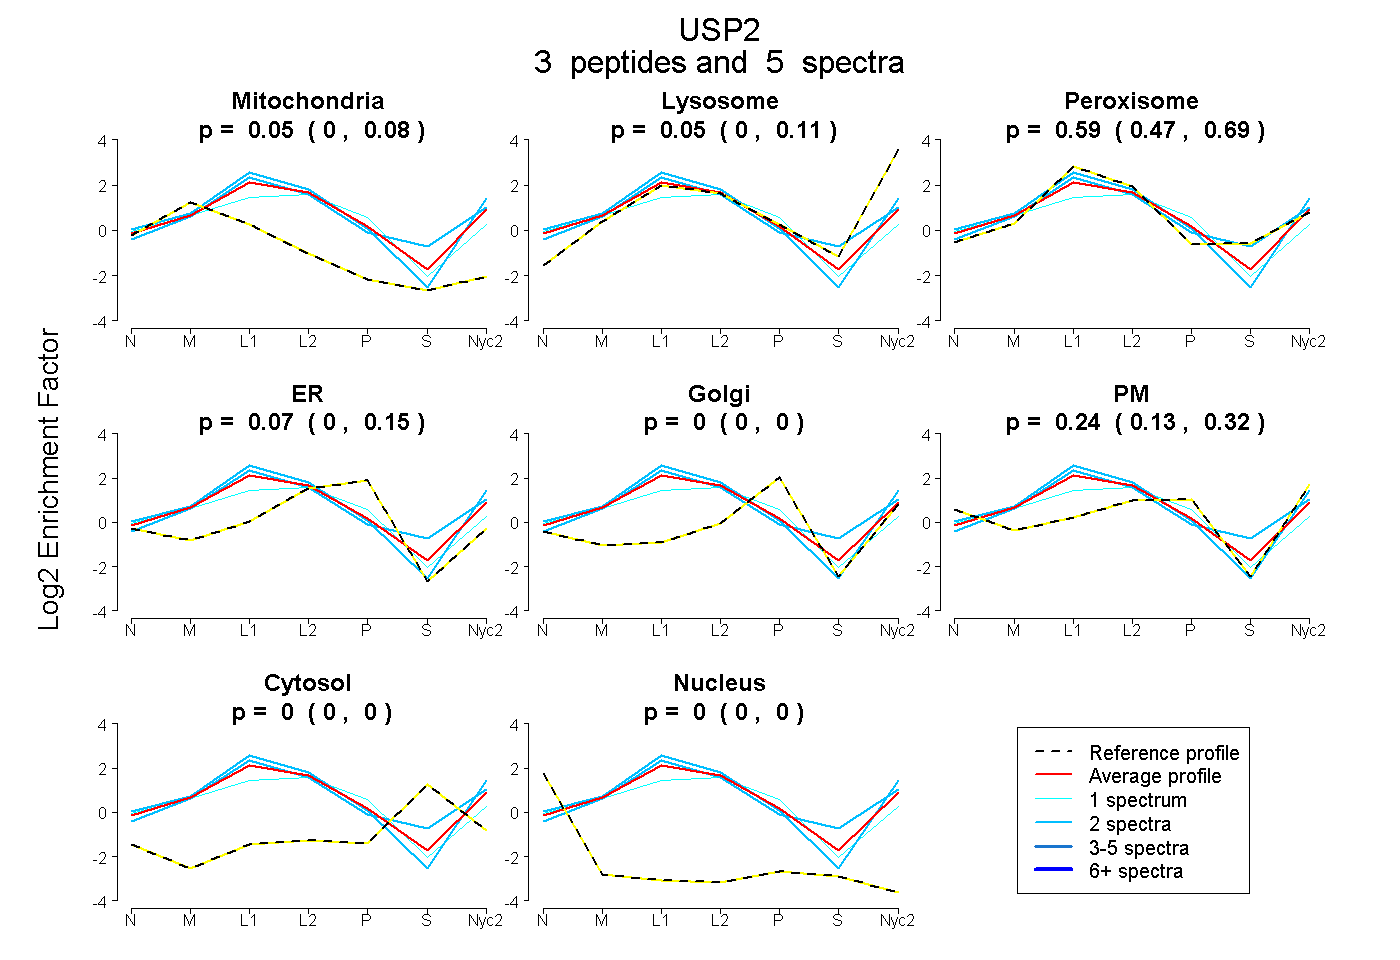
| Expt A |
3 peptides |
5 spectra |
|
0.046 0.002 | 0.084 |
0.045 0.000 | 0.111 |
0.591 0.467 | 0.690 |
0.074 0.000 | 0.150 |
0.000 0.000 | 0.000 |
0.243 0.134 | 0.318 |
0.000 0.000 | 0.000 |
0.000 0.000 | 0.000 |
| 1 spectrum, EDVLDGDEKPTCCR | 0.098 | 0.000 | 0.420 | 0.322 | 0.000 | 0.160 | 0.000 | 0.000 | ||
| 2 spectra, SAQGLAGLR | 0.030 | 0.097 | 0.763 | 0.000 | 0.025 | 0.086 | 0.000 | 0.000 | ||
| 2 spectra, LTTFVNFPLR | 0.020 | 0.108 | 0.528 | 0.000 | 0.000 | 0.344 | 0.000 | 0.000 |
| Plot | Mito | Lyso or Perox | ER | Golgi | PM | Cytosol | Nucleus | ||||||
| Expt B |
2 peptides |
4 spectra |
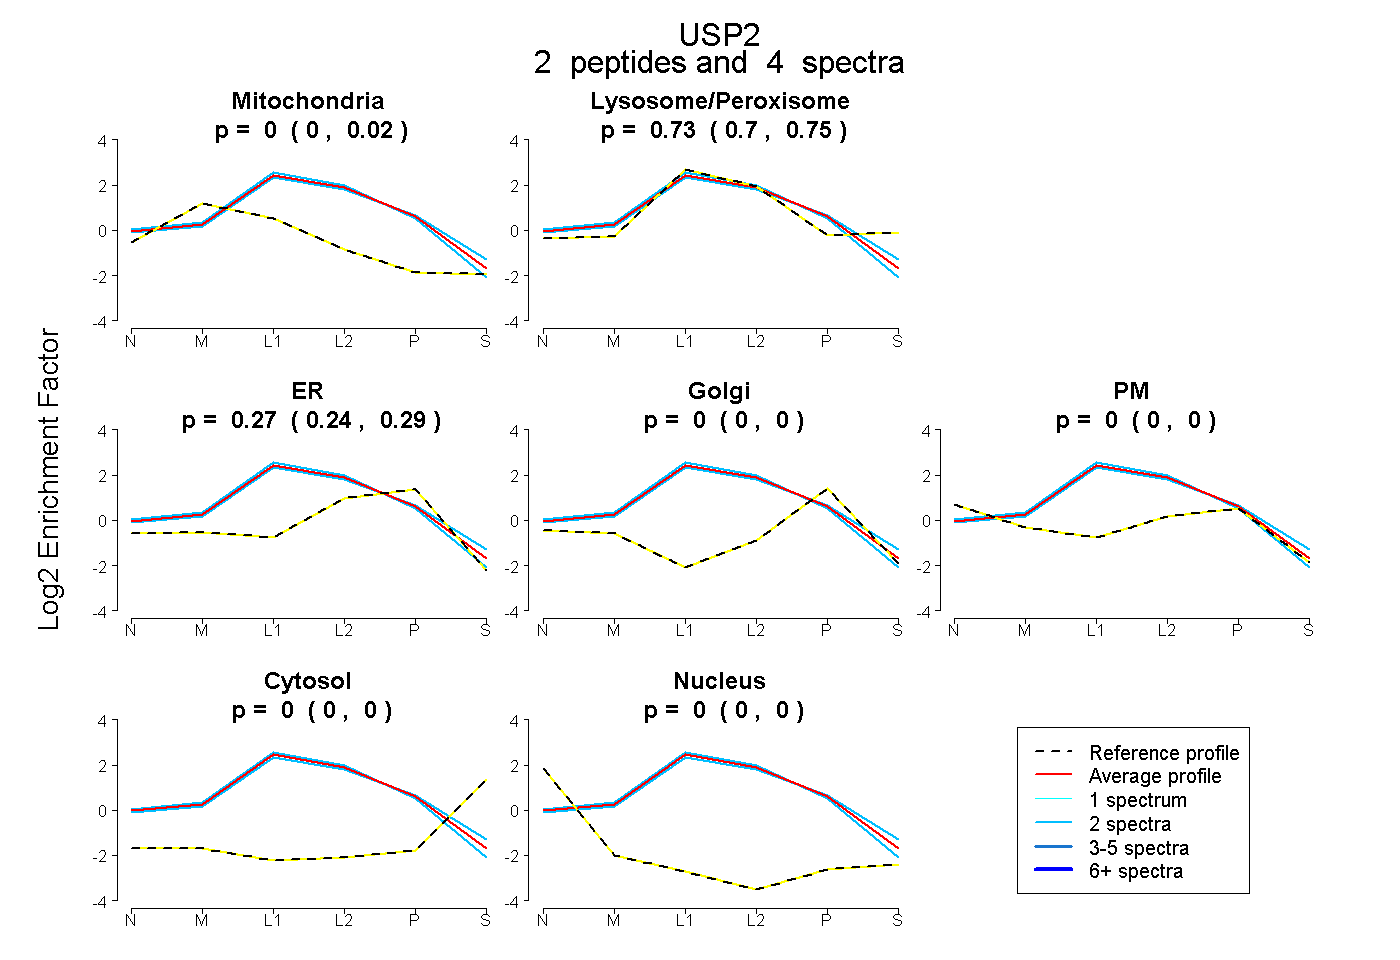 |
0.002 0.000 | 0.016 |
0.730 0.699 | 0.753 |
0.268 0.242 | 0.285 |
0.000 0.000 | 0.000 |
0.000 0.000 | 0.000 |
0.000 0.000 | 0.000 |
0.000 0.000 | 0.000 |
|||
| Plot | Lyso | Other | |||||||||||
| Expt C |
7 peptides |
29 spectra |
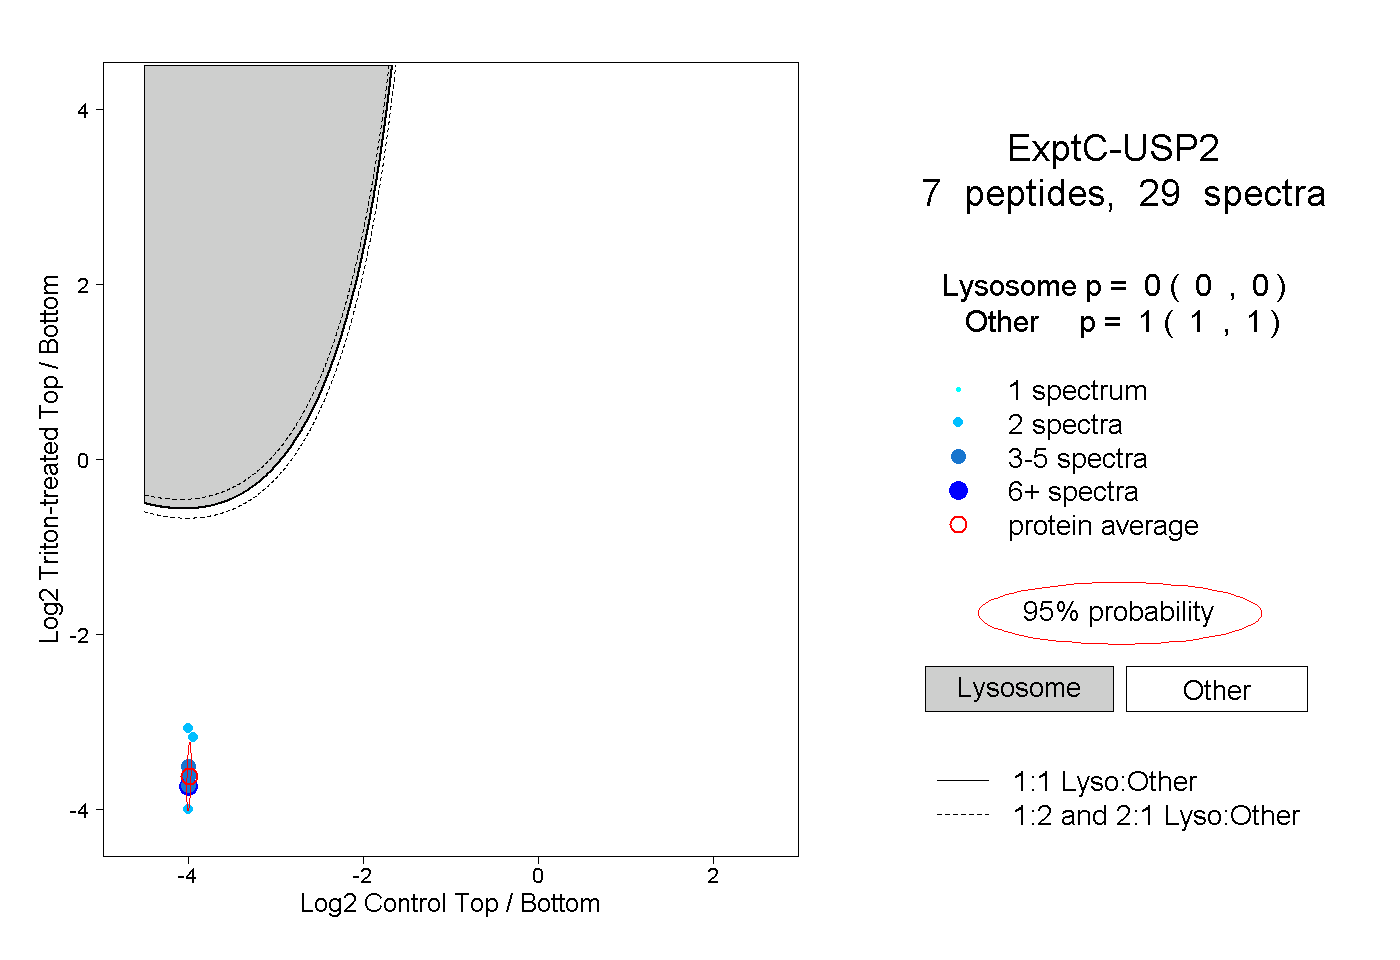 |
0.000 0.000 | 0.000 |
1.000 1.000 | 1.000 |
||||||||
| Plot | Lyso | Other | |||||||||||
| Expt D |
1 peptide |
2 spectra |
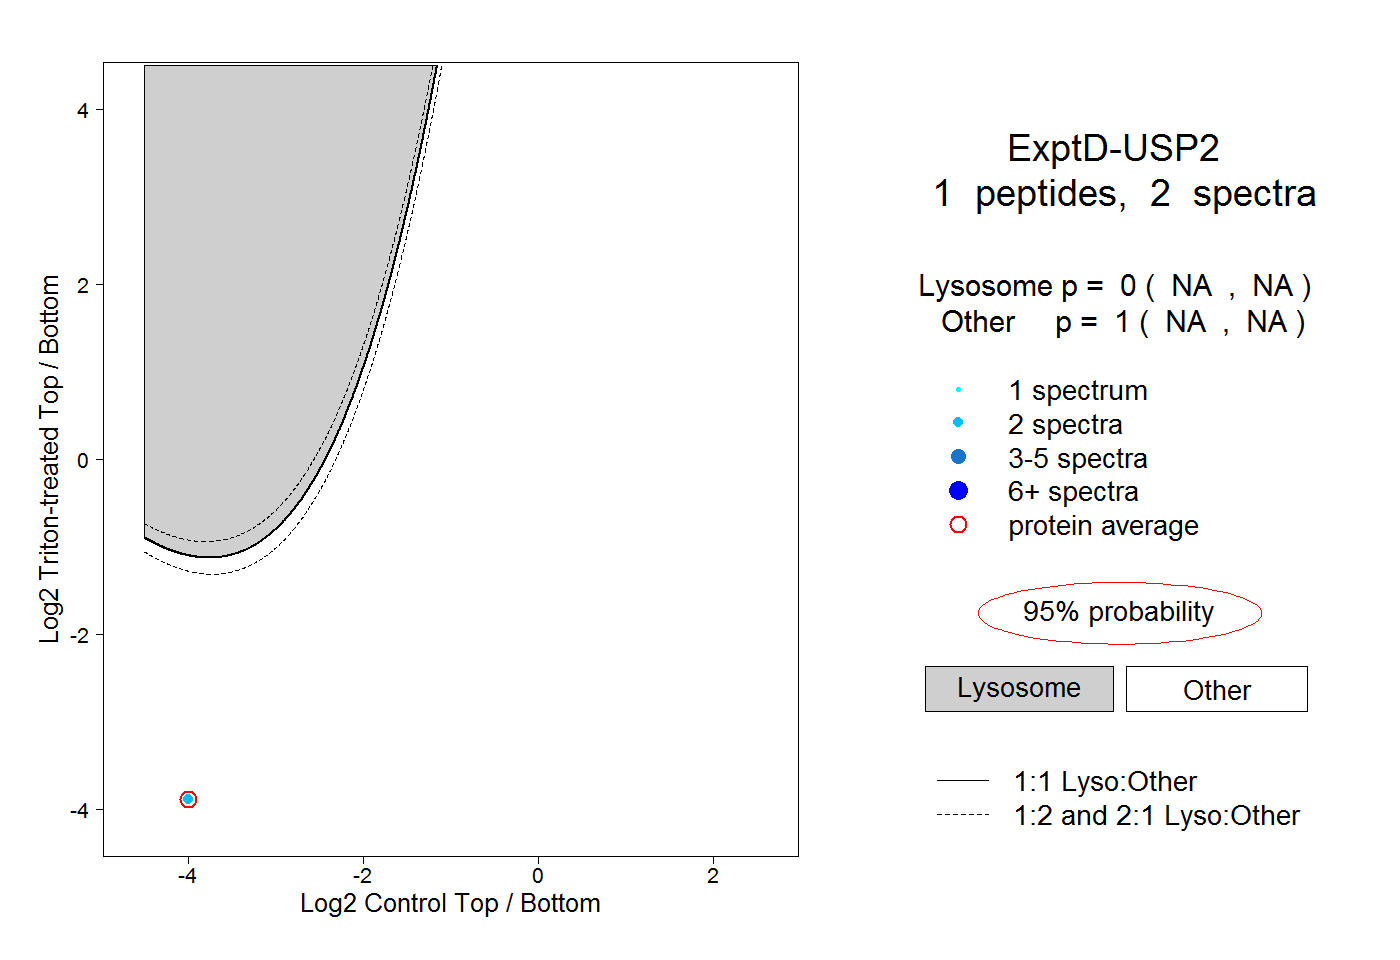 |
0.000 NA | NA |
1.000 NA | NA |