 9
9peptides
spectra

0.000 | 0.000
0.000 | 0.000
0.000 | 0.010
0.000 | 0.013
0.000 | 0.035
0.255 | 0.296
0.687 | 0.711
0.000 | 0.000
4peptides
spectra
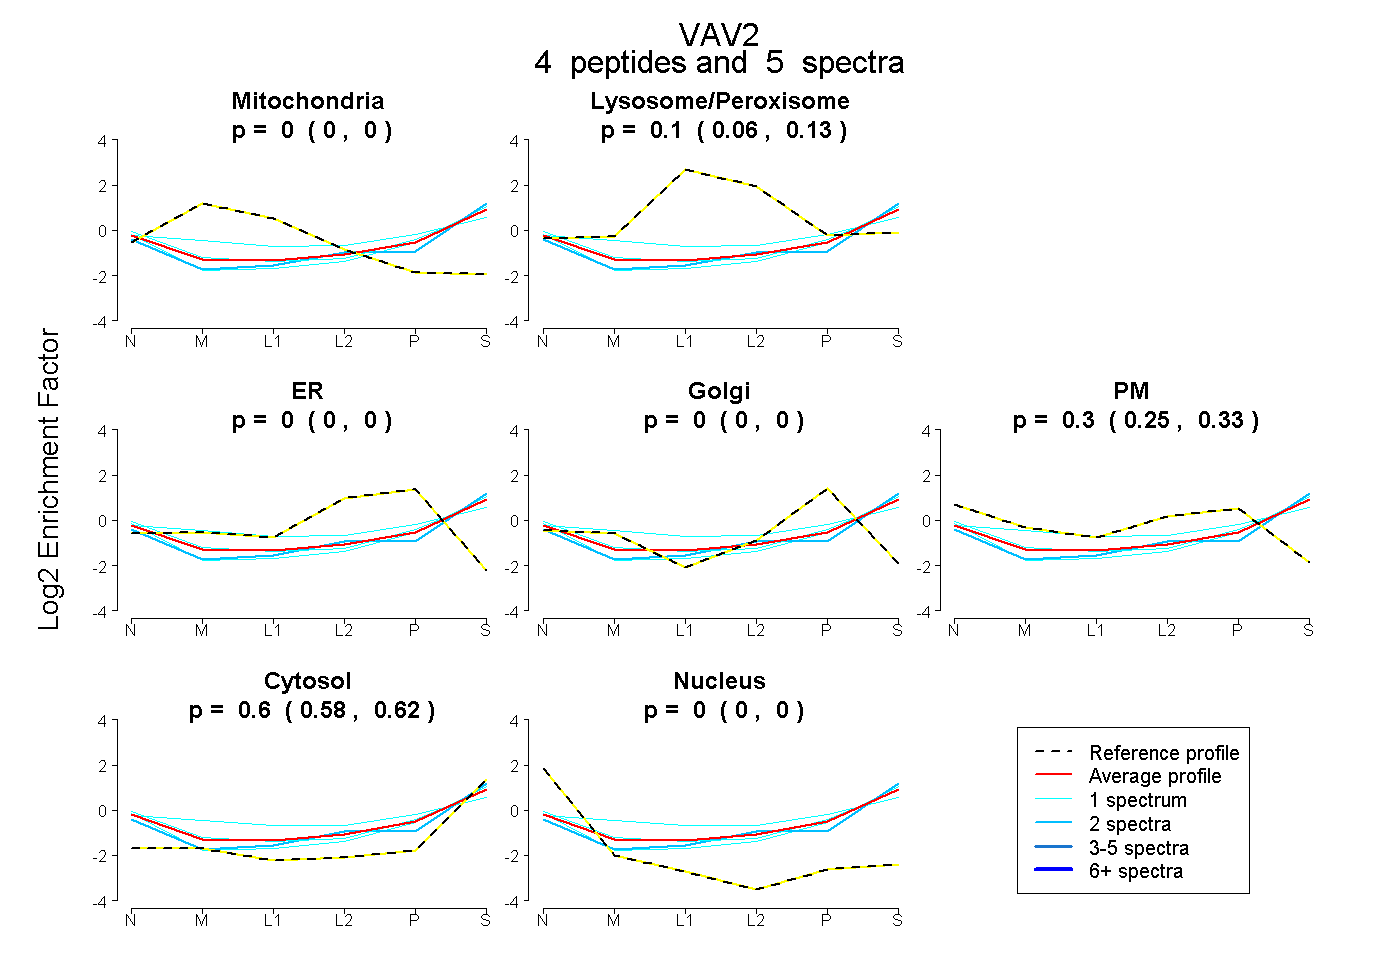
0.000 | 0.000
0.061 | 0.134
0.000 | 0.000
0.000 | 0.000
0.254 | 0.328
0.580 | 0.624
0.000 | 0.003
10peptides
spectra
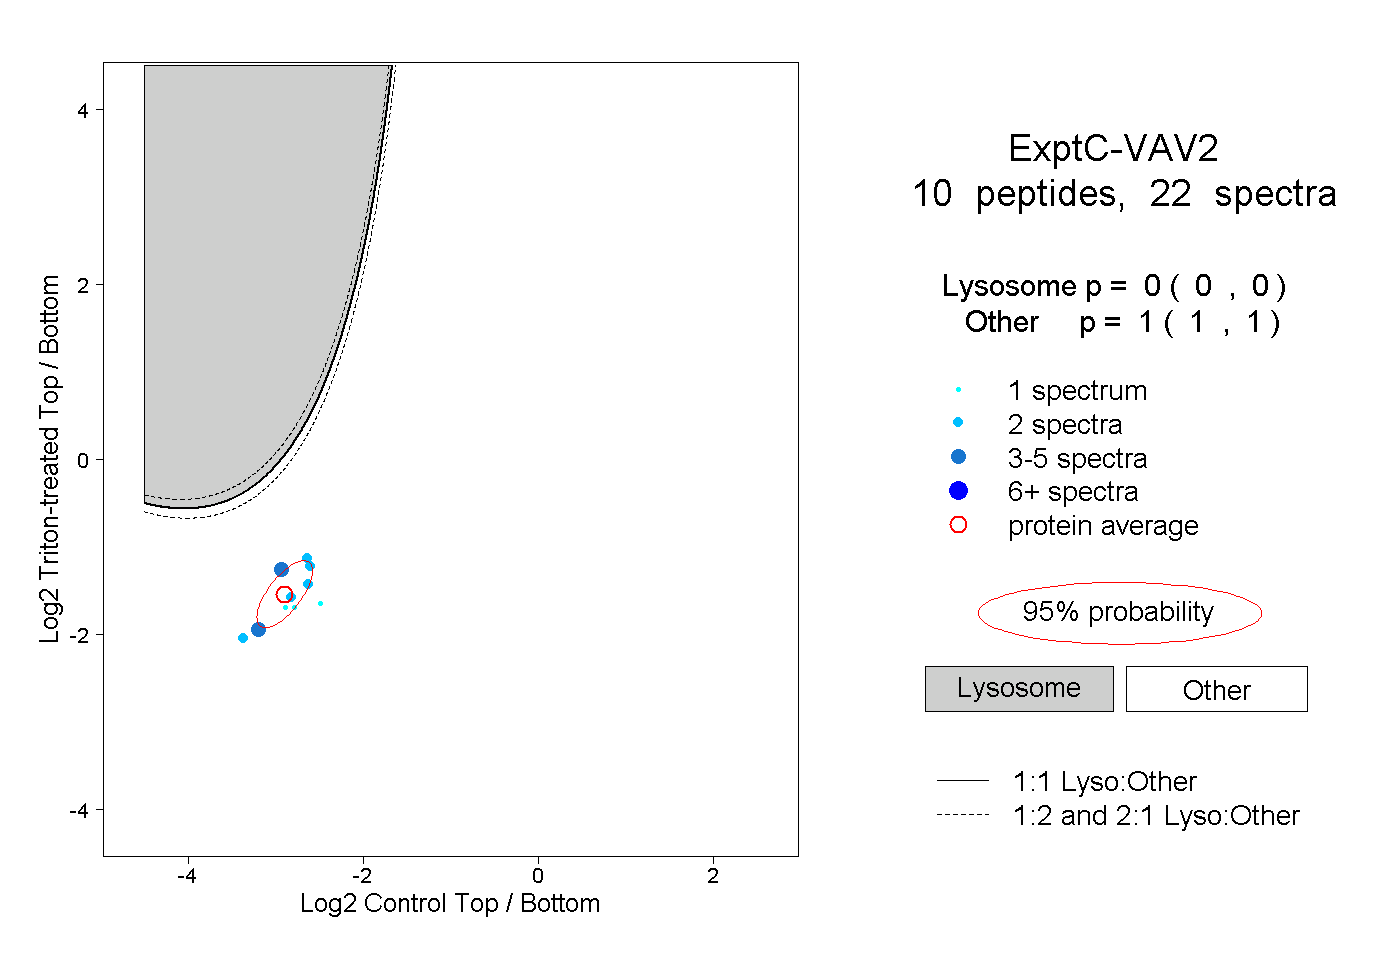
0.000 | 0.000
1.000 | 1.000