 9
9peptides
spectra

0.000 | 0.000
0.000 | 0.000
0.000 | 0.010
0.000 | 0.013
0.000 | 0.035
0.255 | 0.296
0.687 | 0.711
0.000 | 0.000
| Plot | Mito | Lyso | Perox | ER | Golgi | PM | Cytosol | Nucleus | |||||
| Expt A |
9 peptides |
15 spectra |
|
0.000 0.000 | 0.000 |
0.000 0.000 | 0.000 |
0.000 0.000 | 0.010 |
0.000 0.000 | 0.013 |
0.015 0.000 | 0.035 |
0.283 0.255 | 0.296 |
0.702 0.687 | 0.711 |
0.000 0.000 | 0.000 |
| 2 spectra, ELLSHSADRPER | 0.072 | 0.000 | 0.049 | 0.000 | 0.079 | 0.133 | 0.667 | 0.000 | ||
| 2 spectra, VISAVSR | 0.063 | 0.000 | 0.036 | 0.000 | 0.000 | 0.302 | 0.599 | 0.000 | ||
| 2 spectra, QGFQFFCK | 0.000 | 0.000 | 0.000 | 0.000 | 0.035 | 0.308 | 0.657 | 0.000 | ||
| 1 spectrum, DINFRPQMSQFLCLK | 0.000 | 0.000 | 0.000 | 0.119 | 0.087 | 0.000 | 0.762 | 0.033 | ||
| 2 spectra, VFLEFK | 0.000 | 0.000 | 0.000 | 0.000 | 0.098 | 0.172 | 0.730 | 0.000 | ||
| 2 spectra, ERPAEAER | 0.000 | 0.000 | 0.000 | 0.109 | 0.012 | 0.091 | 0.788 | 0.000 | ||
| 1 spectrum, GDPDSPWWEGR | 0.063 | 0.000 | 0.035 | 0.000 | 0.000 | 0.238 | 0.665 | 0.000 | ||
| 2 spectra, EVIELLFHK | 0.000 | 0.000 | 0.000 | 0.000 | 0.129 | 0.084 | 0.787 | 0.000 | ||
| 1 spectrum, GYSYELK | 0.282 | 0.001 | 0.213 | 0.000 | 0.183 | 0.080 | 0.242 | 0.000 |
| Plot | Mito | Lyso or Perox | ER | Golgi | PM | Cytosol | Nucleus | ||||||
| Expt B |
4 peptides |
5 spectra |
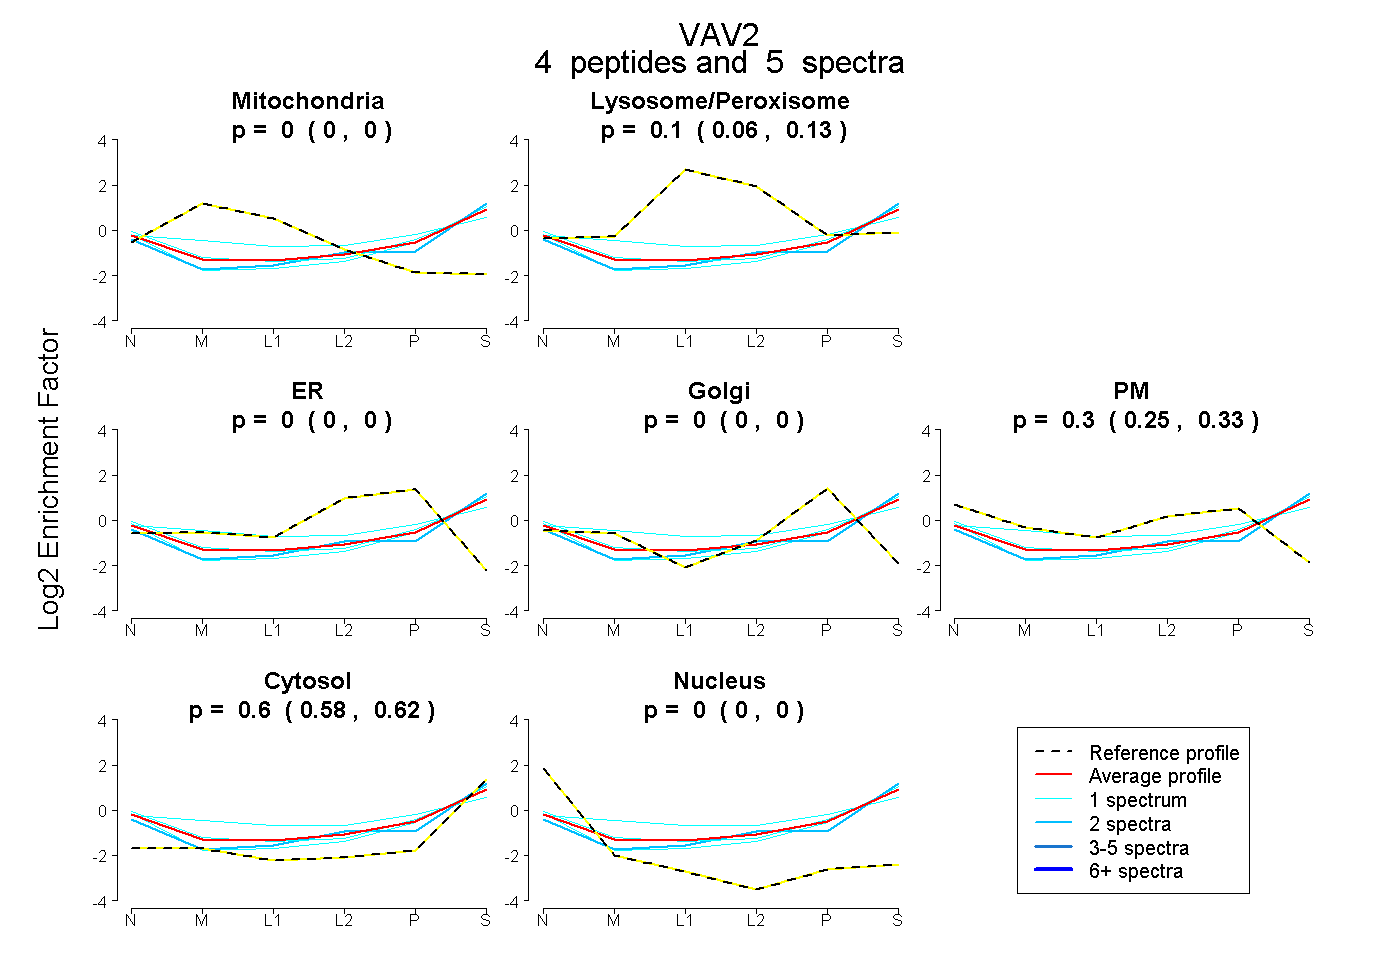 |
0.000 0.000 | 0.000 |
0.100 0.061 | 0.134 |
0.000 0.000 | 0.000 |
0.000 0.000 | 0.000 |
0.296 0.254 | 0.328 |
0.604 0.580 | 0.624 |
0.000 0.000 | 0.003 |
|||
| Plot | Lyso | Other | |||||||||||
| Expt C |
10 peptides |
22 spectra |
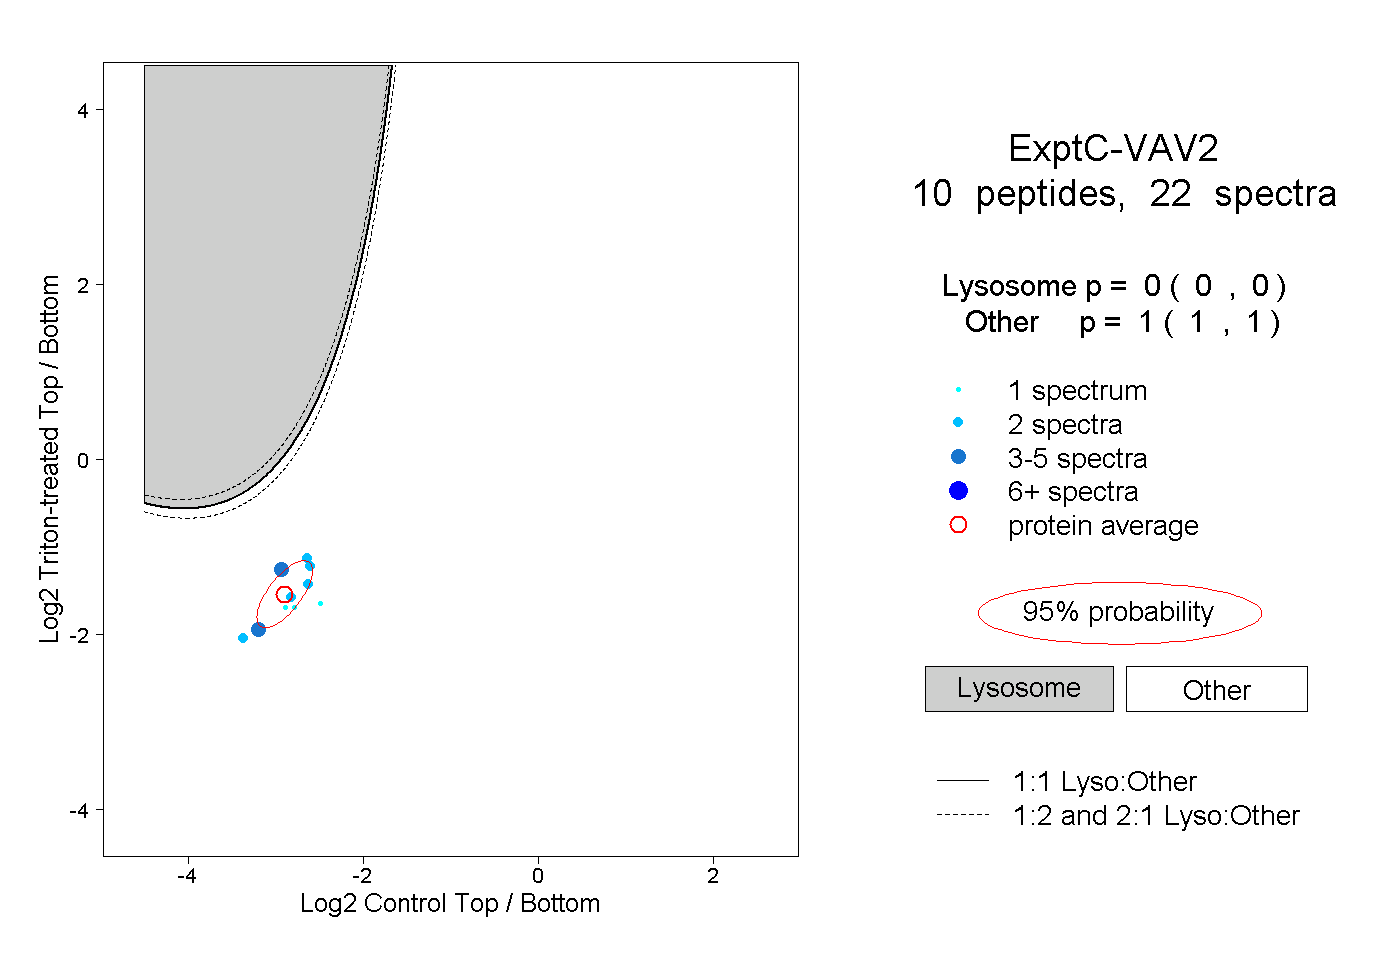 |
0.000 0.000 | 0.000 |
1.000 1.000 | 1.000 |