 11
11peptides
spectra
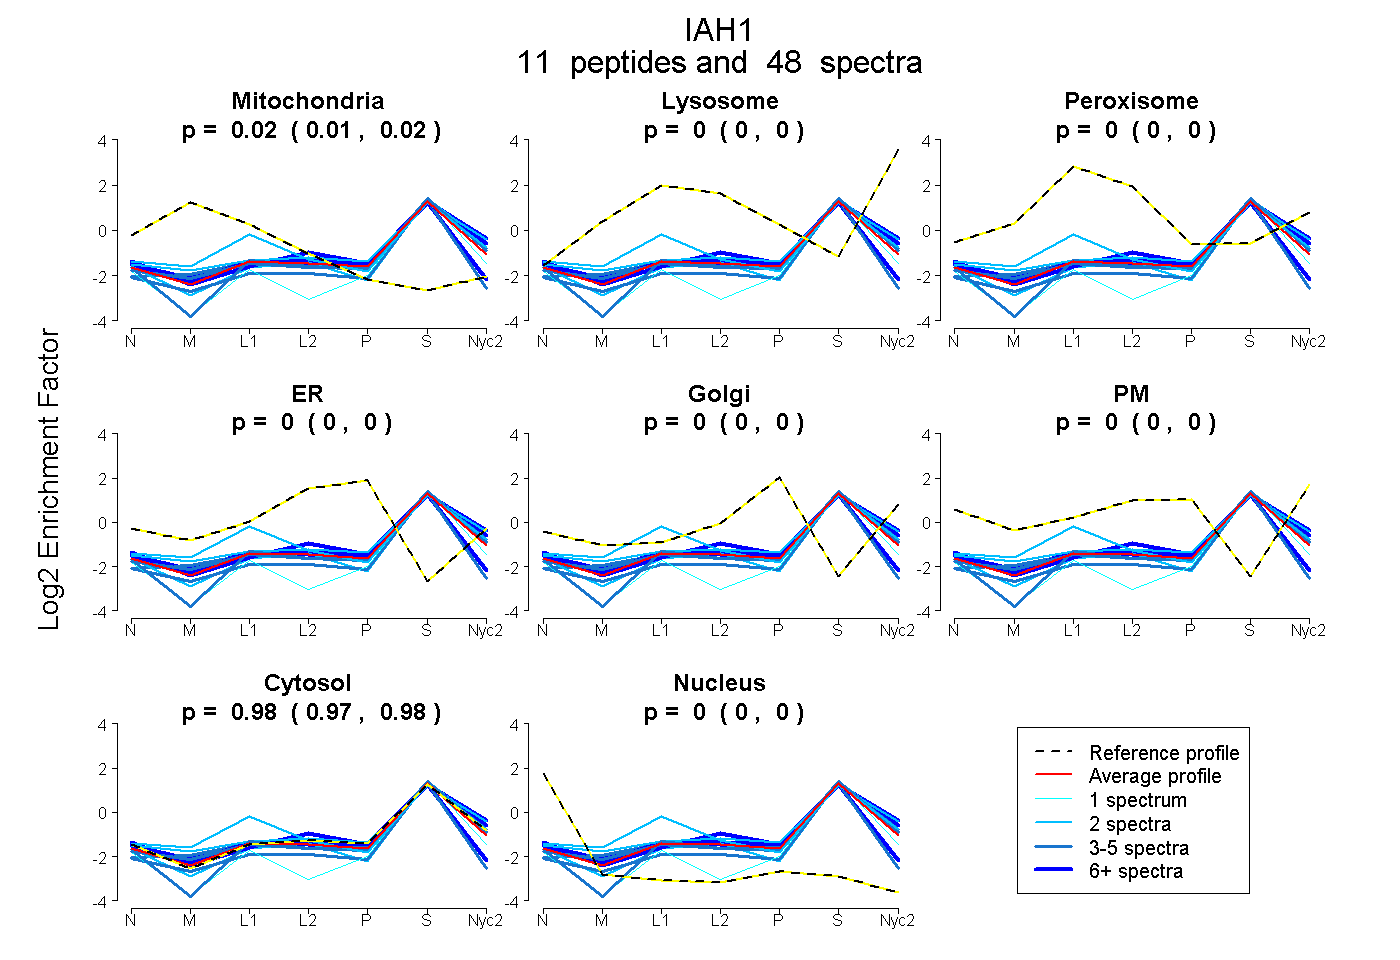
0.014 | 0.024
0.000 | 0.000
0.000 | 0.000
0.000 | 0.000
0.000 | 0.000
0.000 | 0.000
0.974 | 0.984
0.000 | 0.003
6peptides
spectra
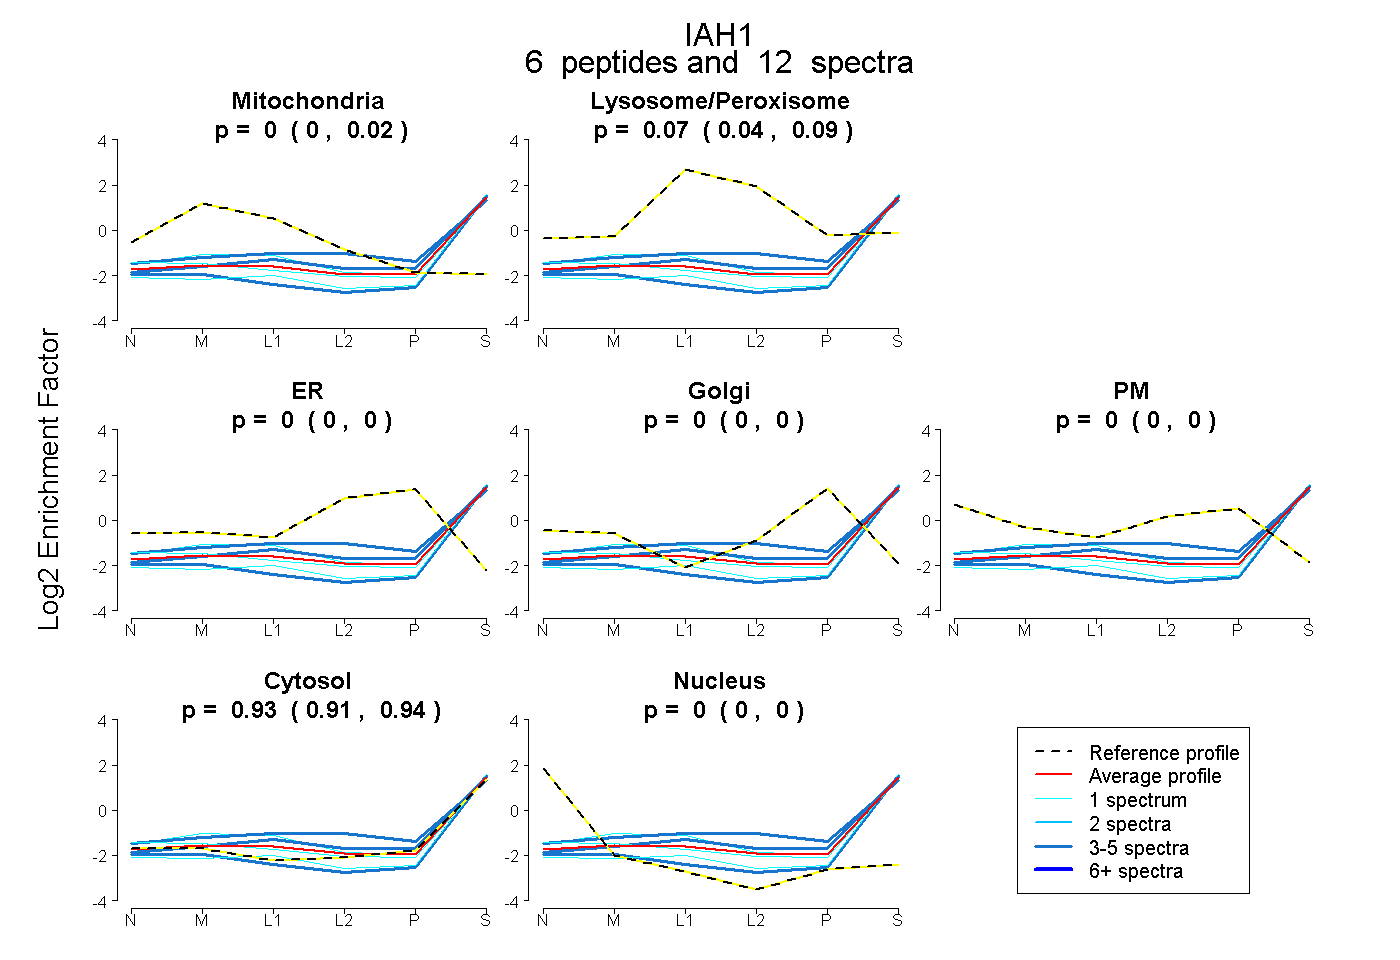
0.000 | 0.019
0.038 | 0.090
0.000 | 0.000
0.000 | 0.000
0.000 | 0.000
0.906 | 0.945
0.000 | 0.000
10peptides
spectra
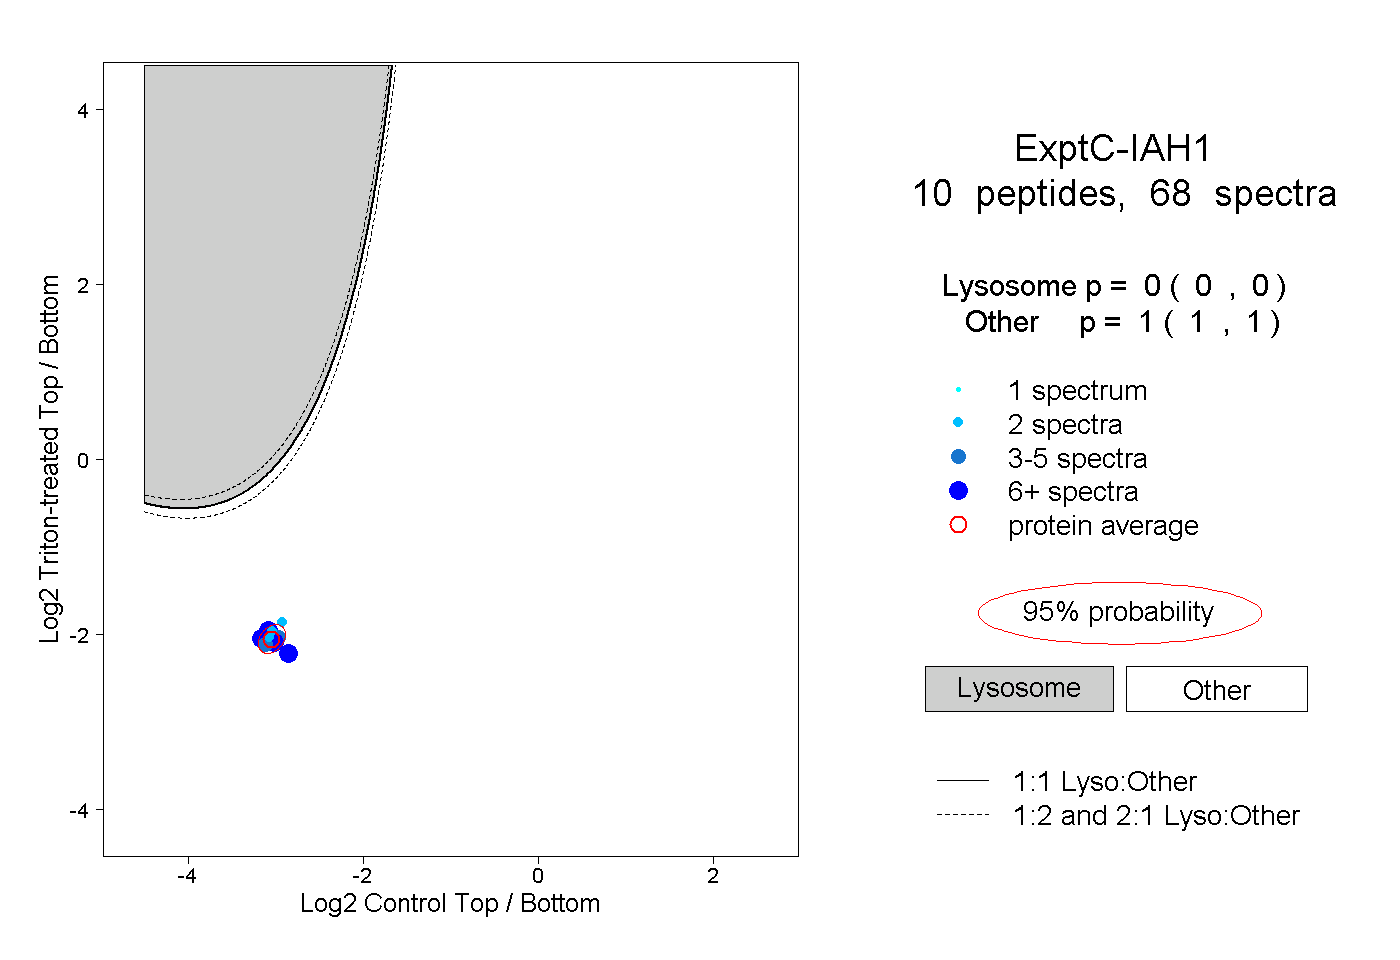
0.000 | 0.000
1.000 | 1.000
3peptides
spectra
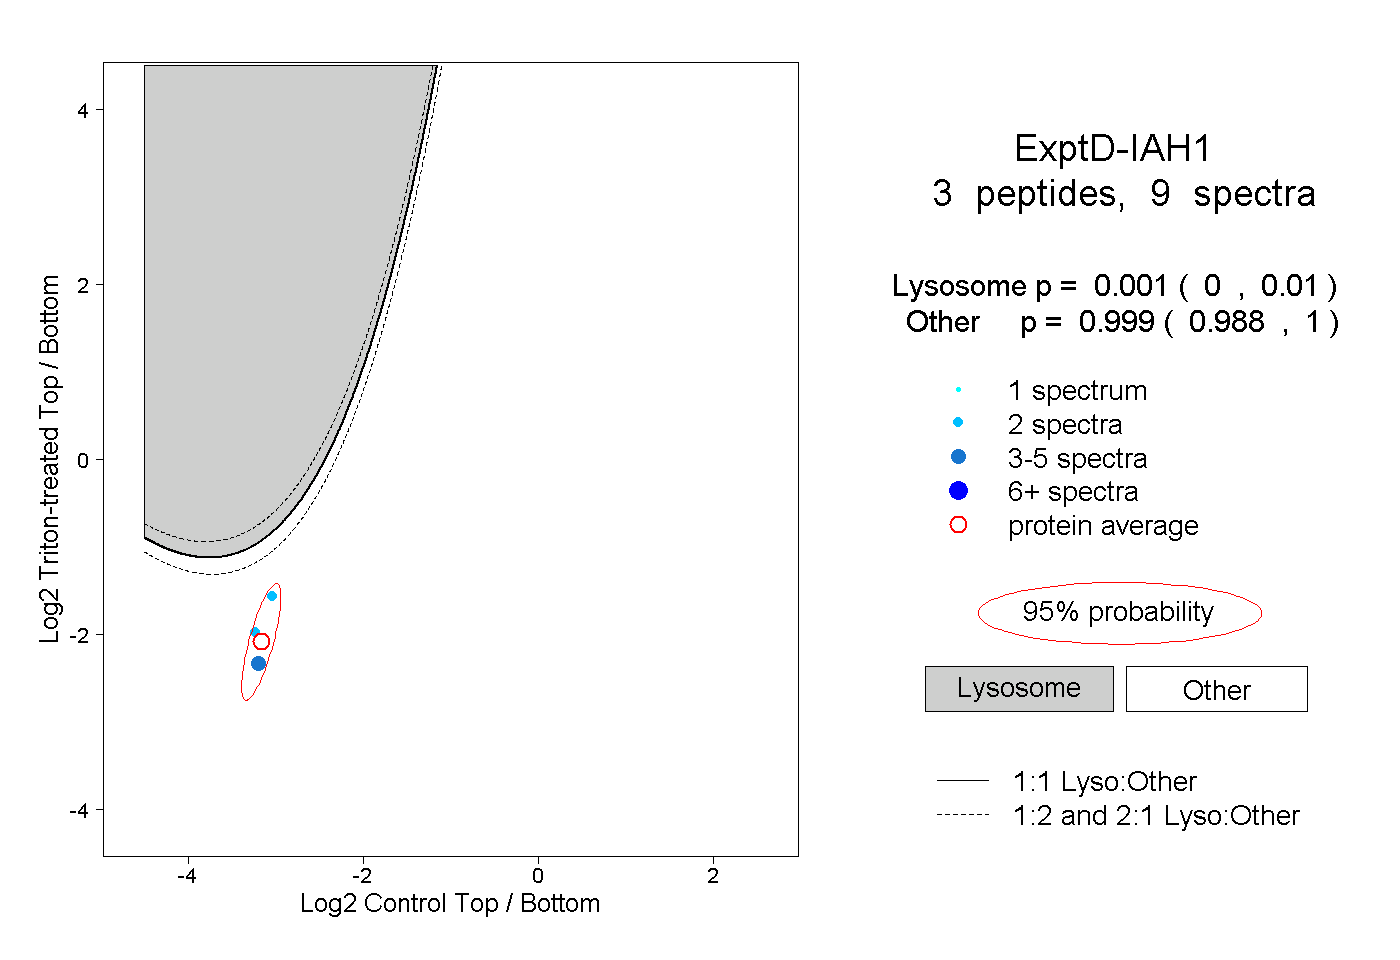
0.000 | 0.010
0.988 | 1.000