 11
11peptides
spectra
0.014 | 0.024
0.000 | 0.000
0.000 | 0.000
0.000 | 0.000
0.000 | 0.000
0.000 | 0.000
0.974 | 0.984
0.000 | 0.003
| Plot | Mito | Lyso | Perox | ER | Golgi | PM | Cytosol | Nucleus | |||||
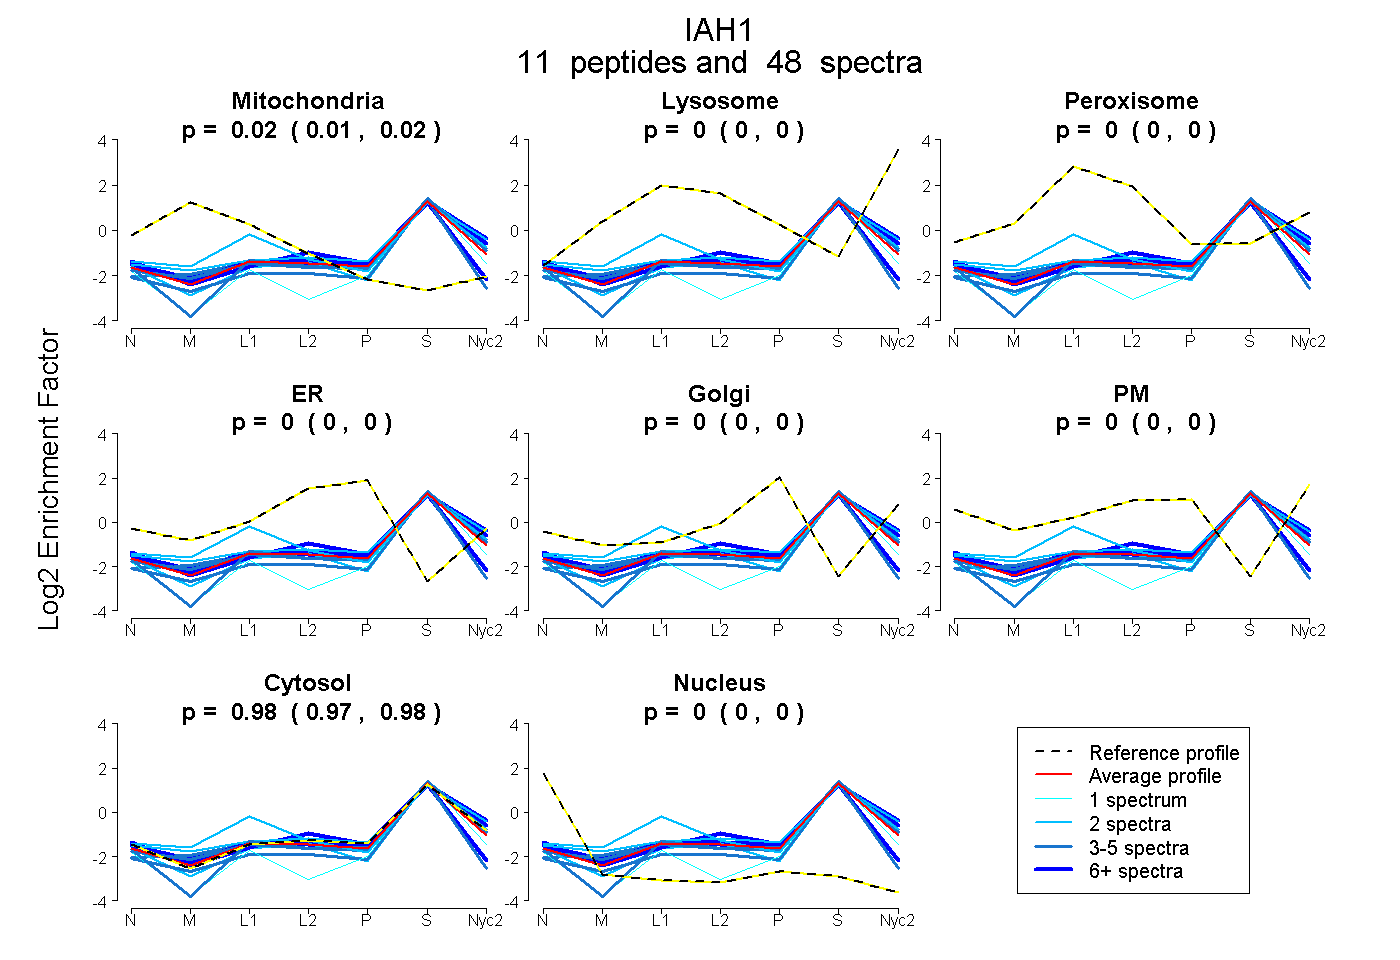
| Expt A |
11 peptides |
48 spectra |
|
0.020 0.014 | 0.024 |
0.000 0.000 | 0.000 |
0.000 0.000 | 0.000 |
0.000 0.000 | 0.000 |
0.000 0.000 | 0.000 |
0.000 0.000 | 0.000 |
0.980 0.974 | 0.984 |
0.000 0.000 | 0.003 |
| 10 spectra, DMVQYLR | 0.000 | 0.047 | 0.000 | 0.000 | 0.000 | 0.000 | 0.953 | 0.000 | ||
| 8 spectra, ACLQVAR | 0.058 | 0.000 | 0.000 | 0.000 | 0.000 | 0.000 | 0.878 | 0.063 | ||
| 2 spectra, VSSLPR | 0.079 | 0.000 | 0.136 | 0.000 | 0.000 | 0.000 | 0.785 | 0.000 | ||
| 1 spectrum, LNVAVGEYAK | 0.000 | 0.000 | 0.000 | 0.000 | 0.000 | 0.000 | 0.894 | 0.106 | ||
| 4 spectra, LLPDWK | 0.000 | 0.000 | 0.000 | 0.000 | 0.000 | 0.000 | 0.992 | 0.008 | ||
| 3 spectra, VILITPPPLCEAAWEK | 0.000 | 0.000 | 0.000 | 0.000 | 0.000 | 0.000 | 0.998 | 0.002 | ||
| 3 spectra, SVDIPK | 0.028 | 0.000 | 0.000 | 0.000 | 0.000 | 0.000 | 0.972 | 0.000 | ||
| 9 spectra, GFSGYNTR | 0.000 | 0.032 | 0.000 | 0.000 | 0.000 | 0.000 | 0.968 | 0.000 | ||
| 2 spectra, QHVPLDEYSANLR | 0.031 | 0.073 | 0.000 | 0.000 | 0.000 | 0.000 | 0.896 | 0.000 | ||
| 4 spectra, DCGTDVLDLWTLMQK | 0.073 | 0.000 | 0.000 | 0.000 | 0.000 | 0.000 | 0.887 | 0.040 | ||
| 2 spectra, DVEETKPELSLLGDGDH | 0.000 | 0.000 | 0.000 | 0.000 | 0.000 | 0.000 | 0.999 | 0.001 |
| Plot | Mito | Lyso or Perox | ER | Golgi | PM | Cytosol | Nucleus | ||||||
| Expt B |
6 peptides |
12 spectra |
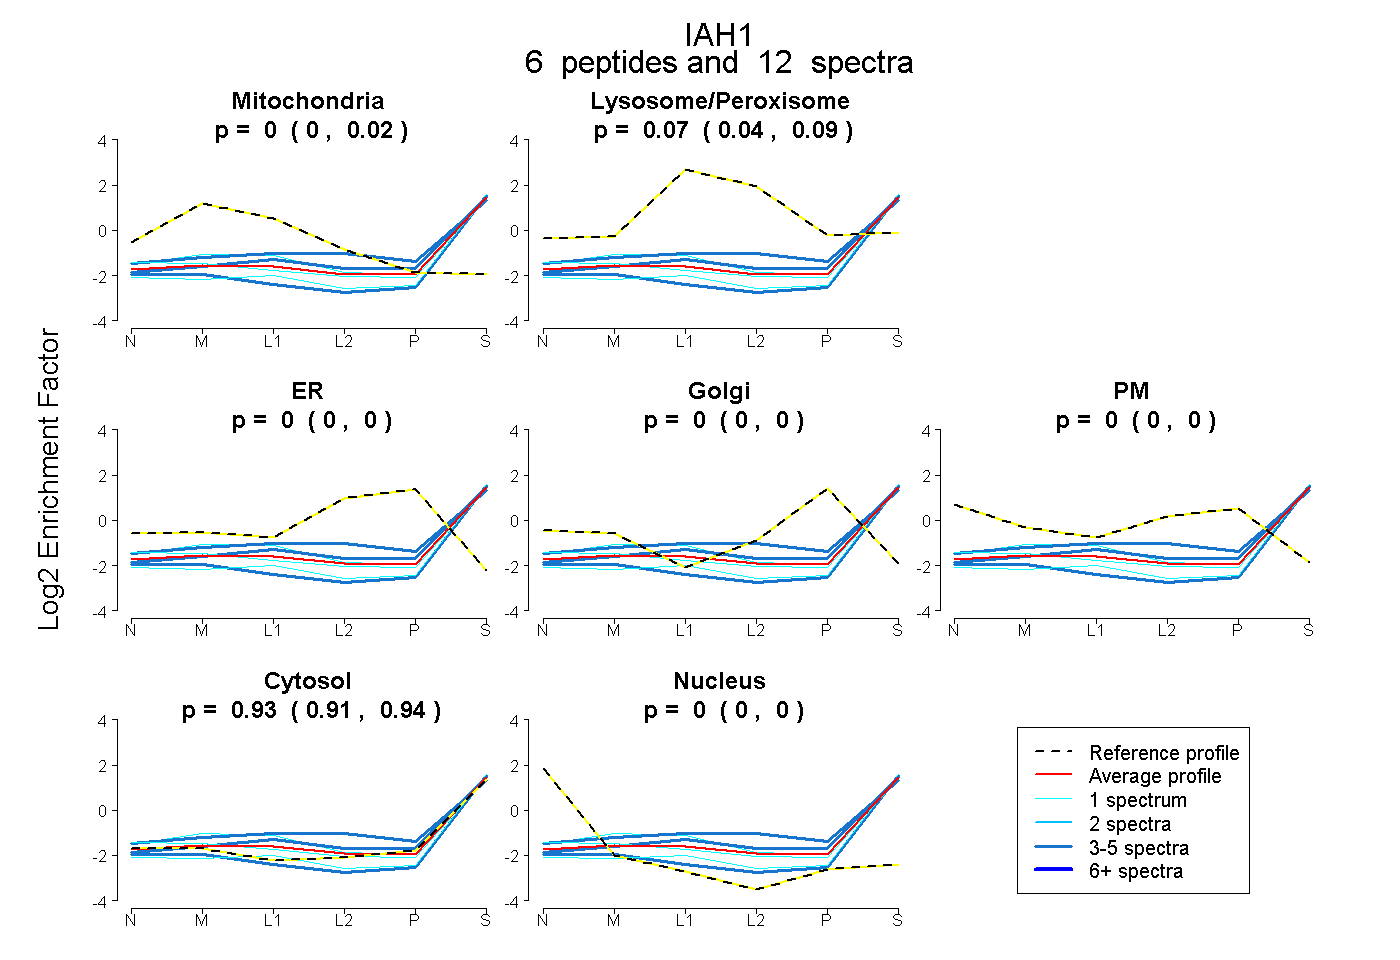 |
0.000 0.000 | 0.019 |
0.071 0.038 | 0.090 |
0.000 0.000 | 0.000 |
0.000 0.000 | 0.000 |
0.000 0.000 | 0.000 |
0.929 0.906 | 0.945 |
0.000 0.000 | 0.000 |
|||
| Plot | Lyso | Other | |||||||||||
| Expt C |
10 peptides |
68 spectra |
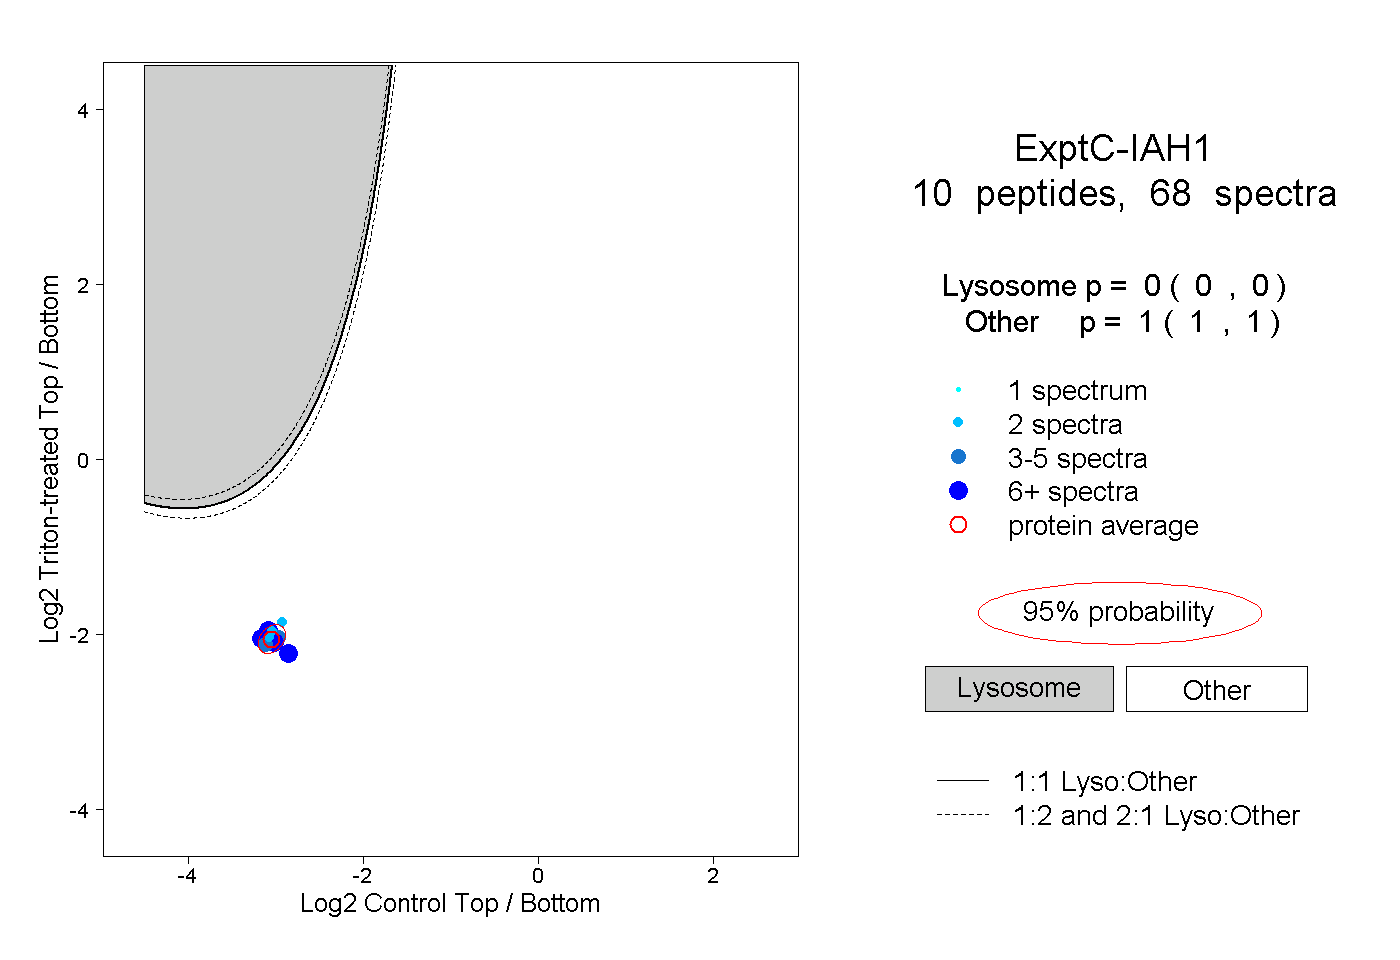 |
0.000 0.000 | 0.000 |
1.000 1.000 | 1.000 |
||||||||
| Plot | Lyso | Other | |||||||||||
| Expt D |
3 peptides |
9 spectra |
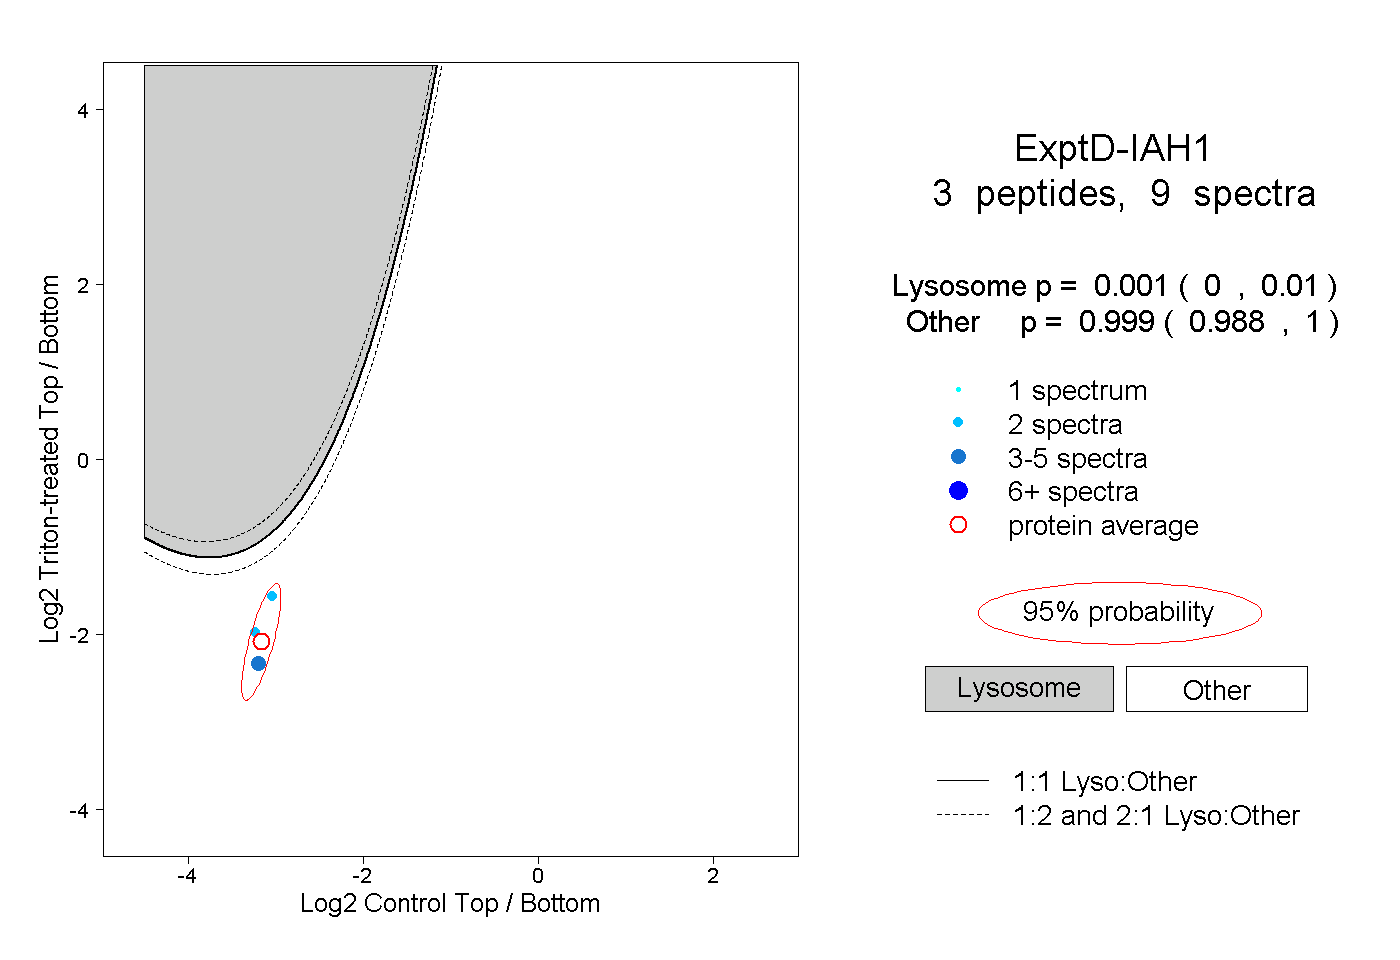 |
0.001 0.000 | 0.010 |
0.999 0.988 | 1.000 |