 3
3peptides
spectra
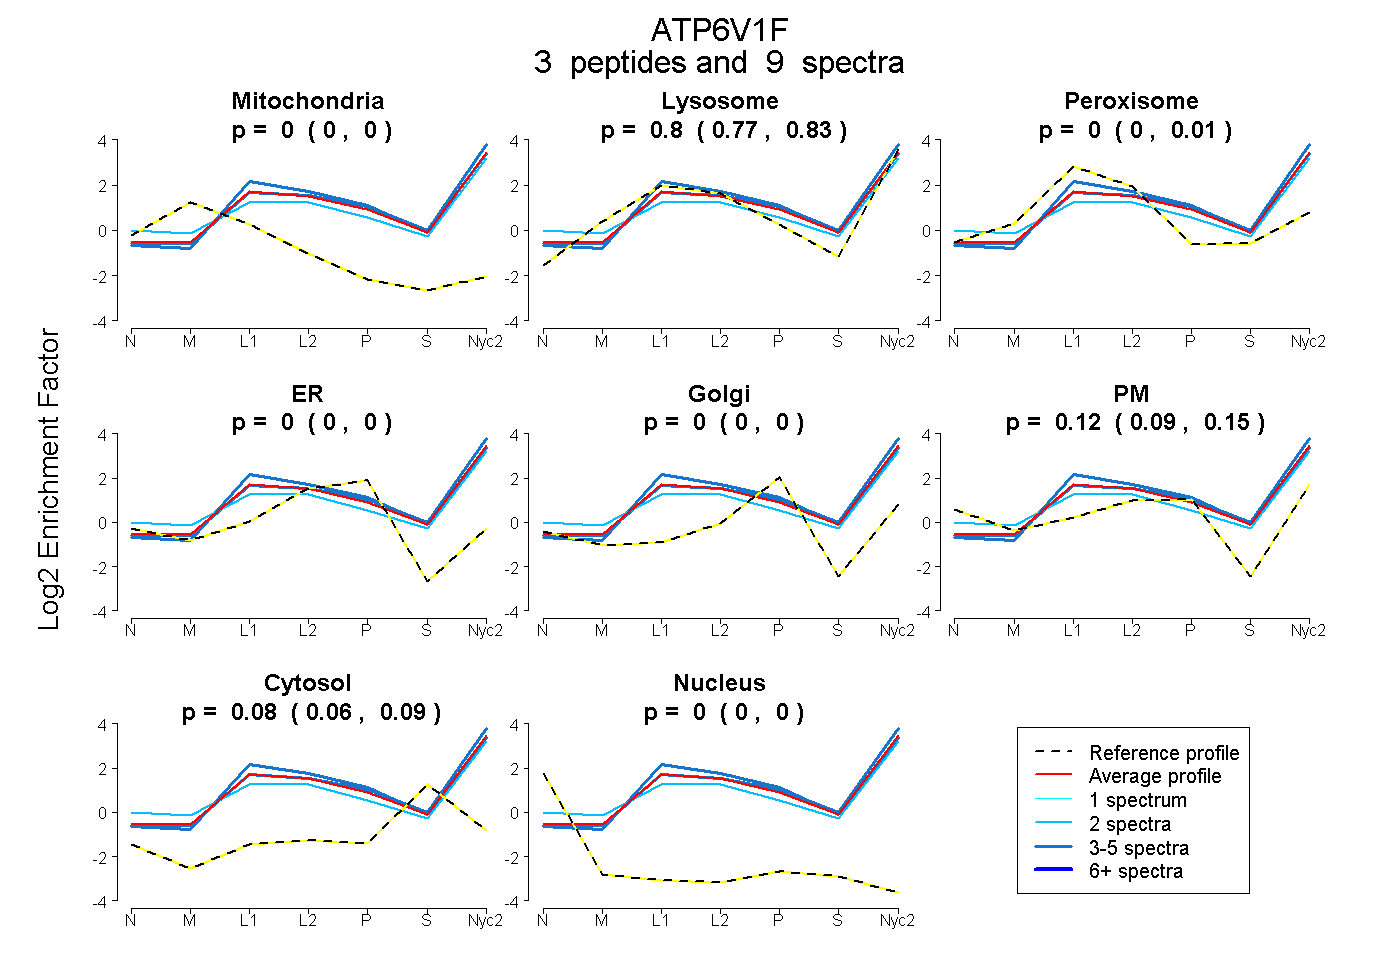
0.000 | 0.000
0.769 | 0.828
0.000 | 0.014
0.000 | 0.000
0.000 | 0.000
0.089 | 0.147
0.060 | 0.089
0.000 | 0.000
6peptides
spectra
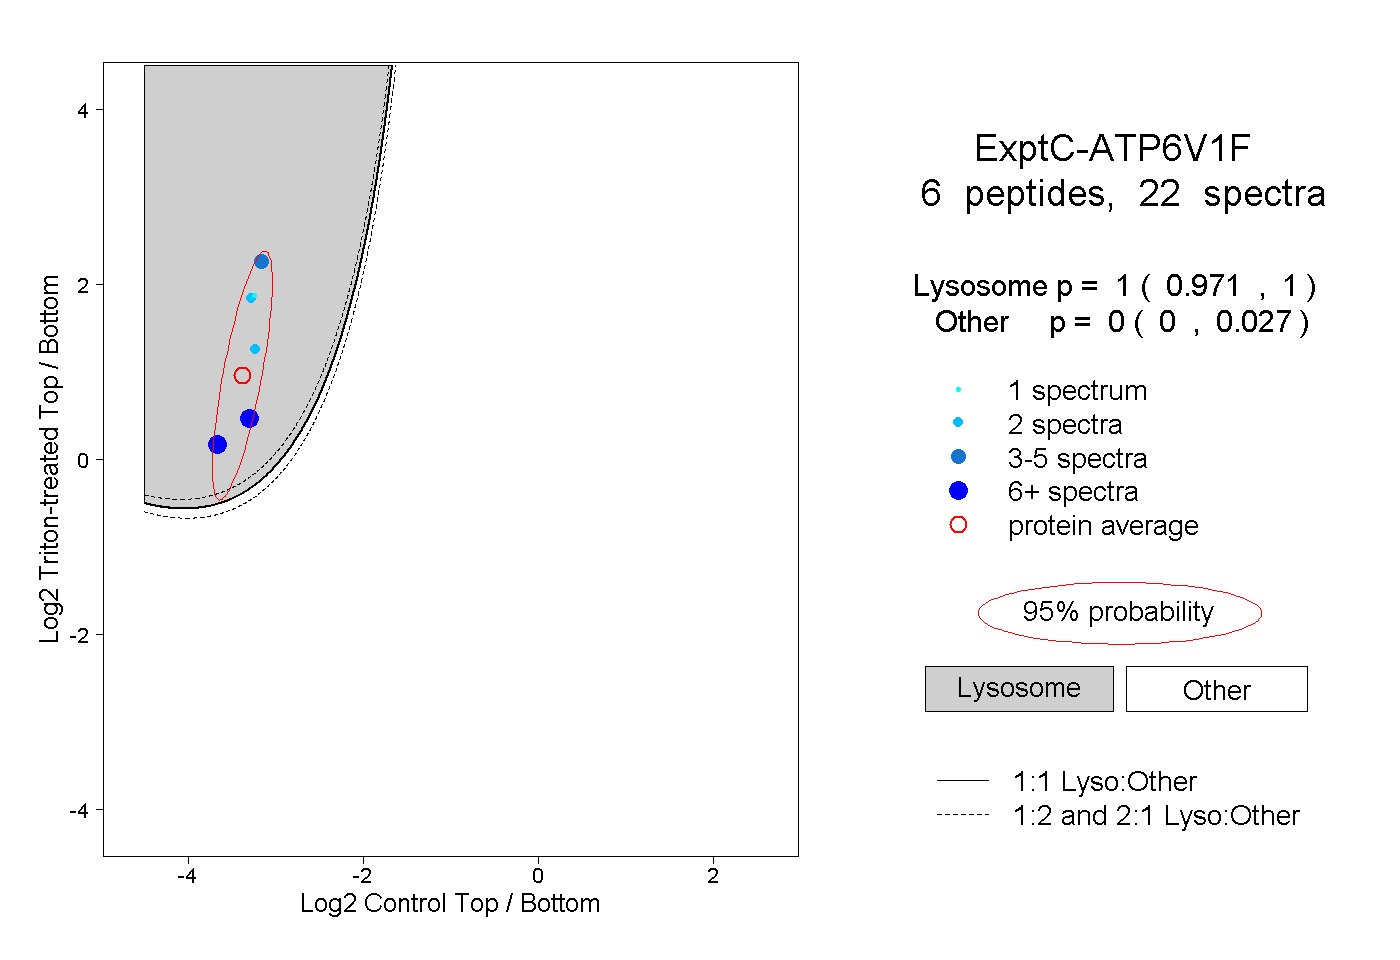
0.971 | 1.000
0.000 | 0.027
1peptide
spectrum
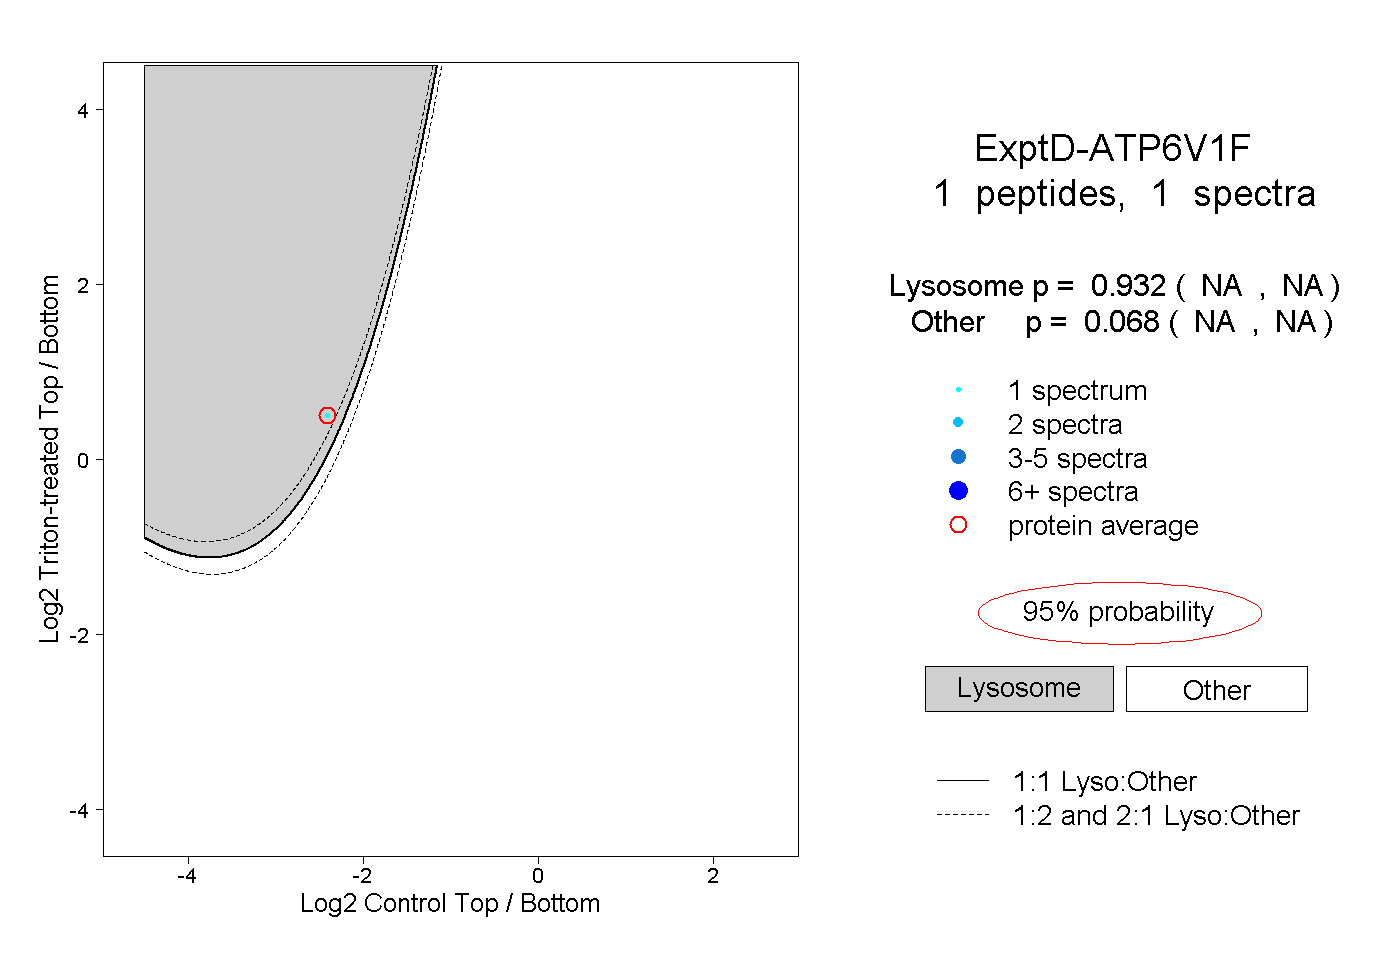
NA | NA
NA | NA