 3
3peptides
spectra
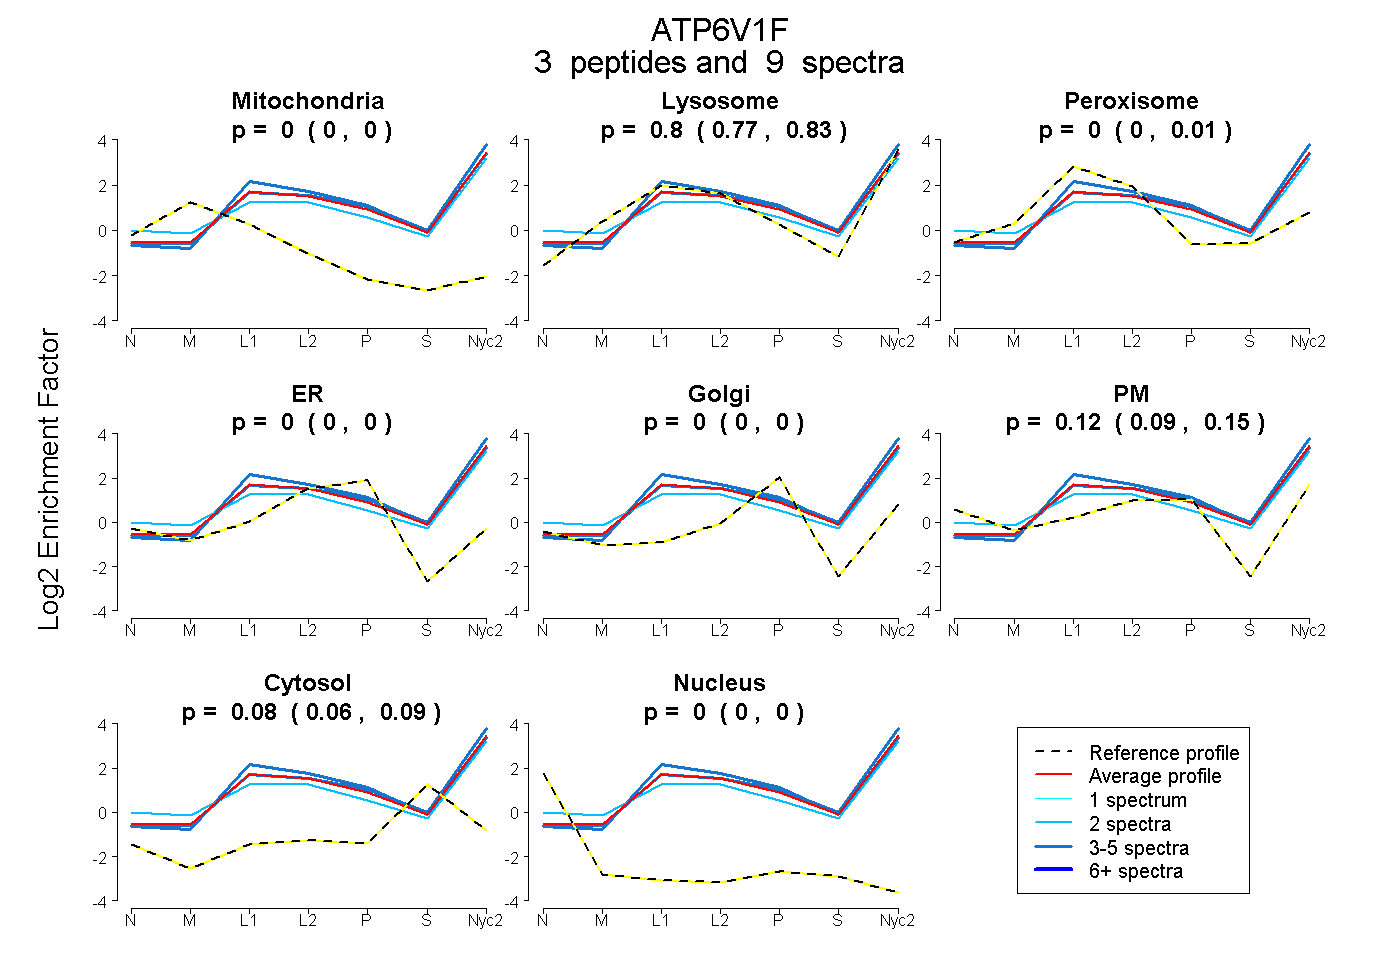
0.000 | 0.000
0.769 | 0.828
0.000 | 0.014
0.000 | 0.000
0.000 | 0.000
0.089 | 0.147
0.060 | 0.089
0.000 | 0.000
6peptides
spectra
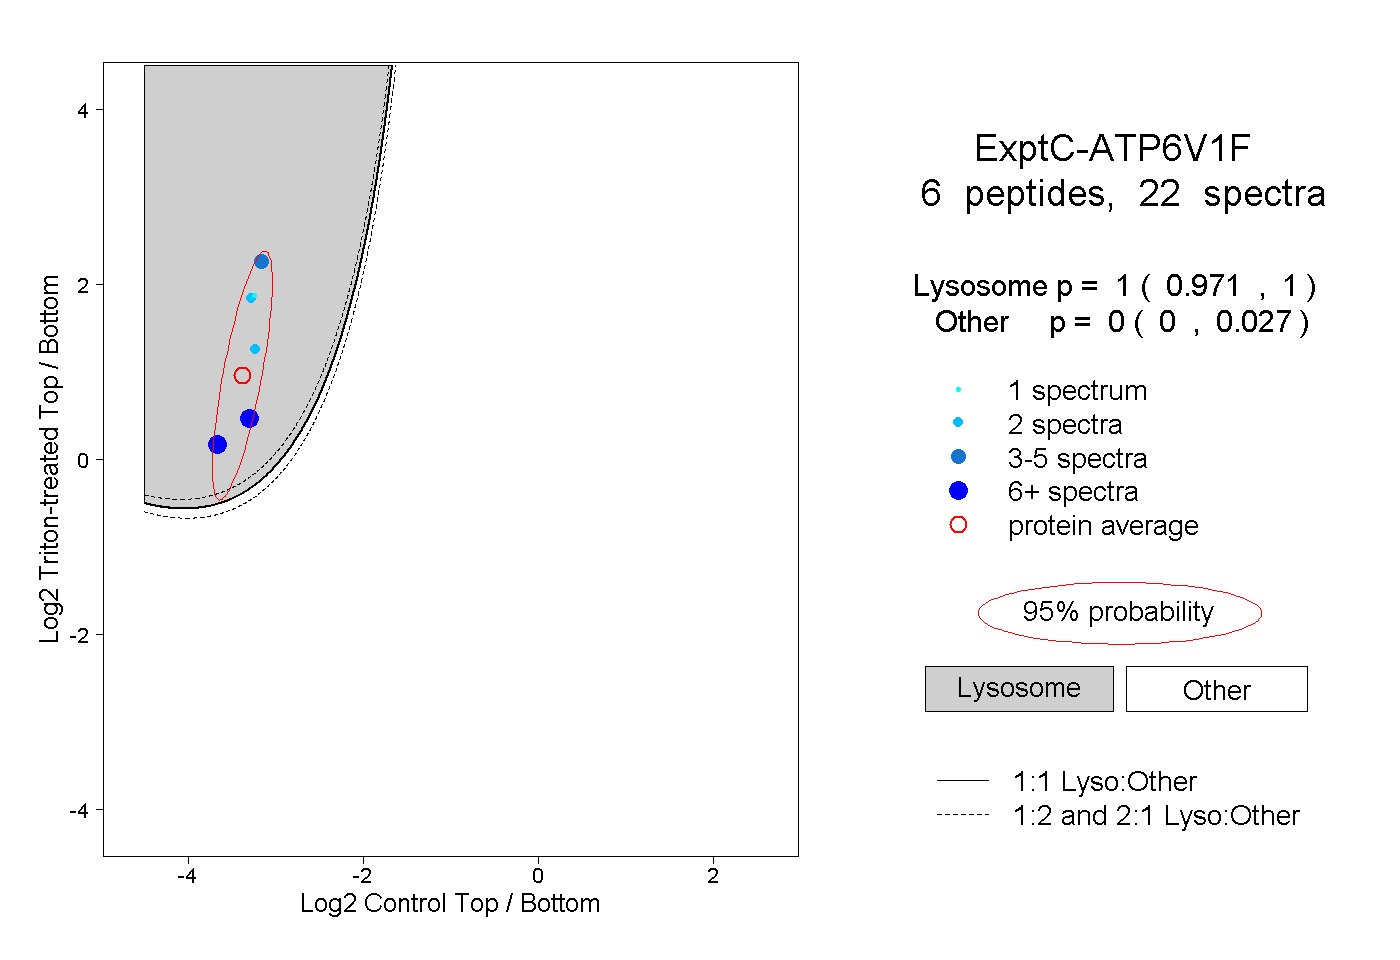
0.971 | 1.000
0.000 | 0.027
| Plot | Mito | Lyso | Perox | ER | Golgi | PM | Cytosol | Nucleus | |||||
| Expt A |
3 peptides |
9 spectra |
|
0.000 0.000 | 0.000 |
0.803 0.769 | 0.828 |
0.000 0.000 | 0.014 |
0.000 0.000 | 0.000 |
0.000 0.000 | 0.000 |
0.121 0.089 | 0.147 |
0.076 0.060 | 0.089 |
0.000 0.000 | 0.000 |
||
| Plot | Lyso | Other | |||||||||||
| Expt C |
6 peptides |
22 spectra |
|
1.000 0.971 | 1.000 |
0.000 0.000 | 0.027 |
| 2 spectra, DSLLR | 1.000 | 0.000 | ||||||||
| 6 spectra, EHPYDAAK | 1.000 | 0.000 | ||||||||
| 2 spectra, HPNFLVVEK | 1.000 | 0.000 | ||||||||
| 4 spectra, DTTINEIEDTFR | 1.000 | 0.000 | ||||||||
| 1 spectrum, SIPAVLEIPSK | 1.000 | 0.000 | ||||||||
| 7 spectra, GMFTAEDLR | 1.000 | 0.000 |
| Plot | Lyso | Other | |||||||||||
| Expt D |
1 peptide |
1 spectrum |
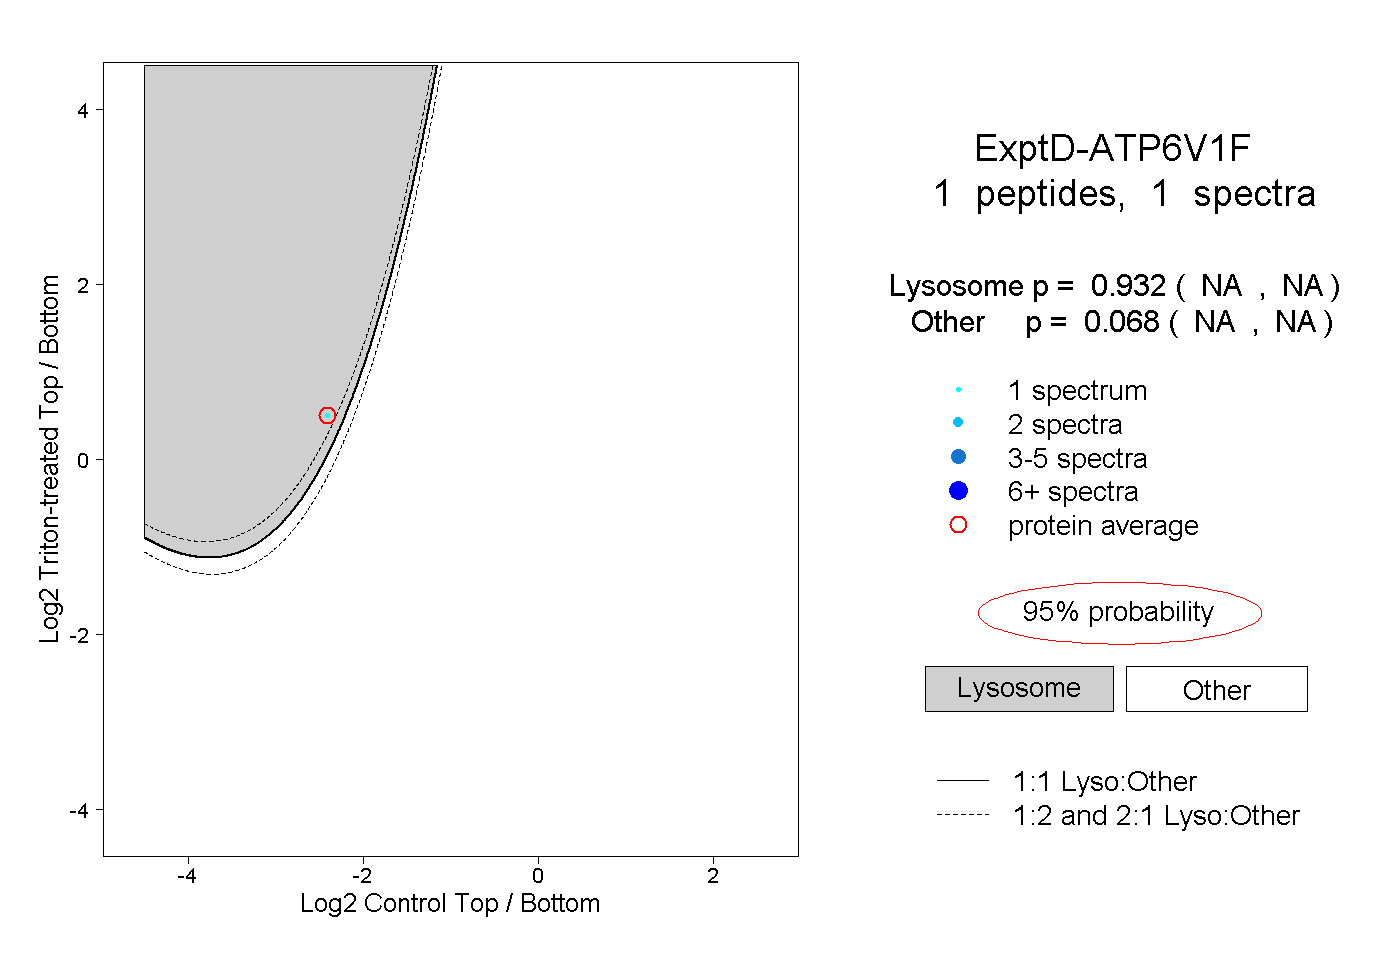 |
0.932 NA | NA |
0.068 NA | NA |