 6
6peptides
spectra
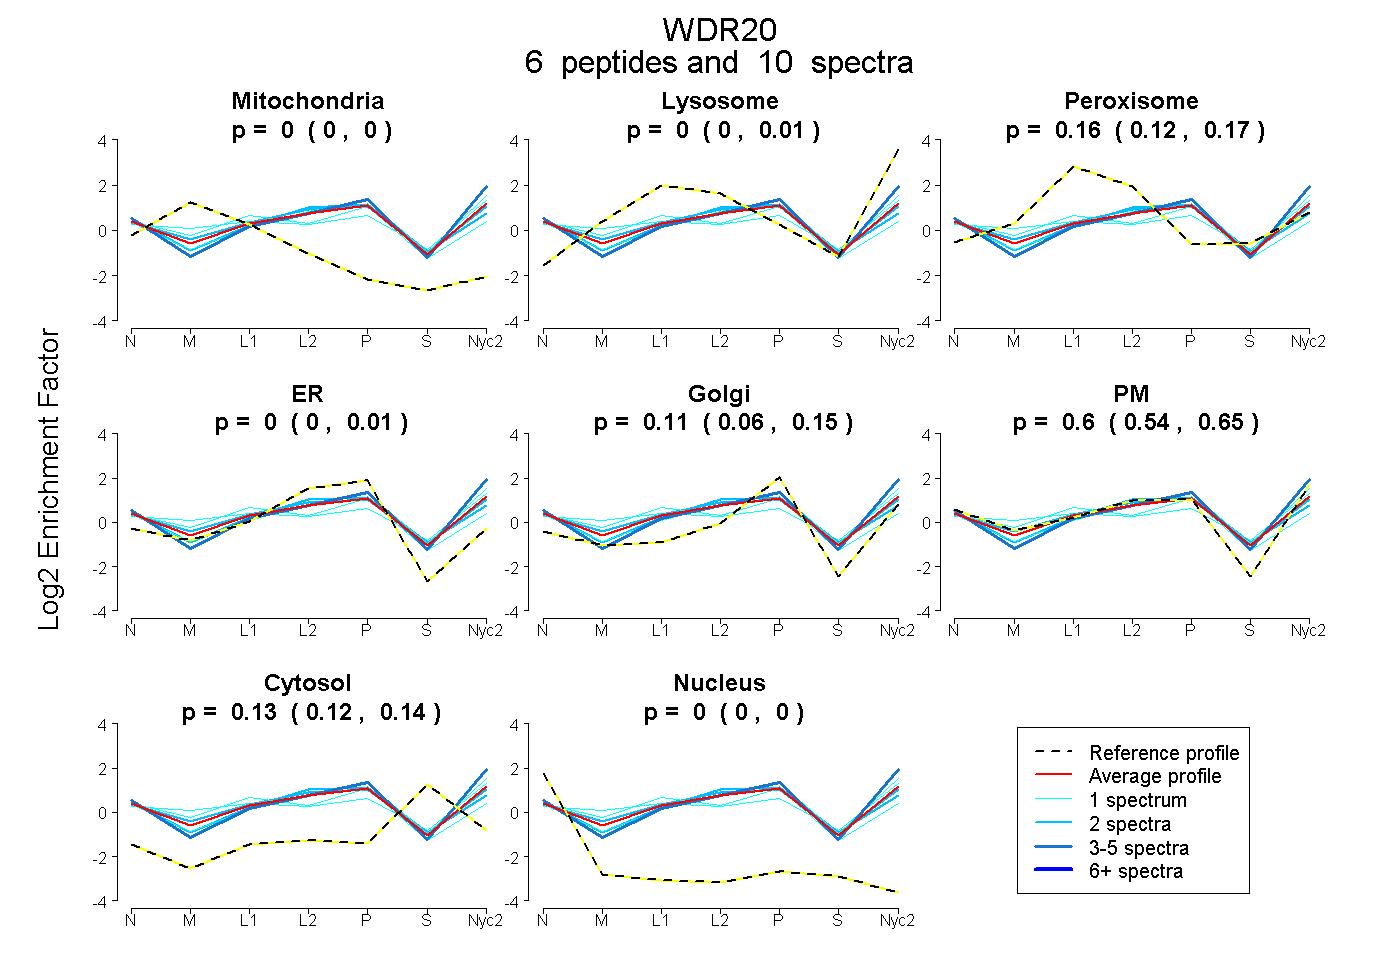
0.000 | 0.000
0.000 | 0.014
0.119 | 0.174
0.000 | 0.007
0.064 | 0.152
0.542 | 0.649
0.118 | 0.145
0.000 | 0.000
5peptides
spectra
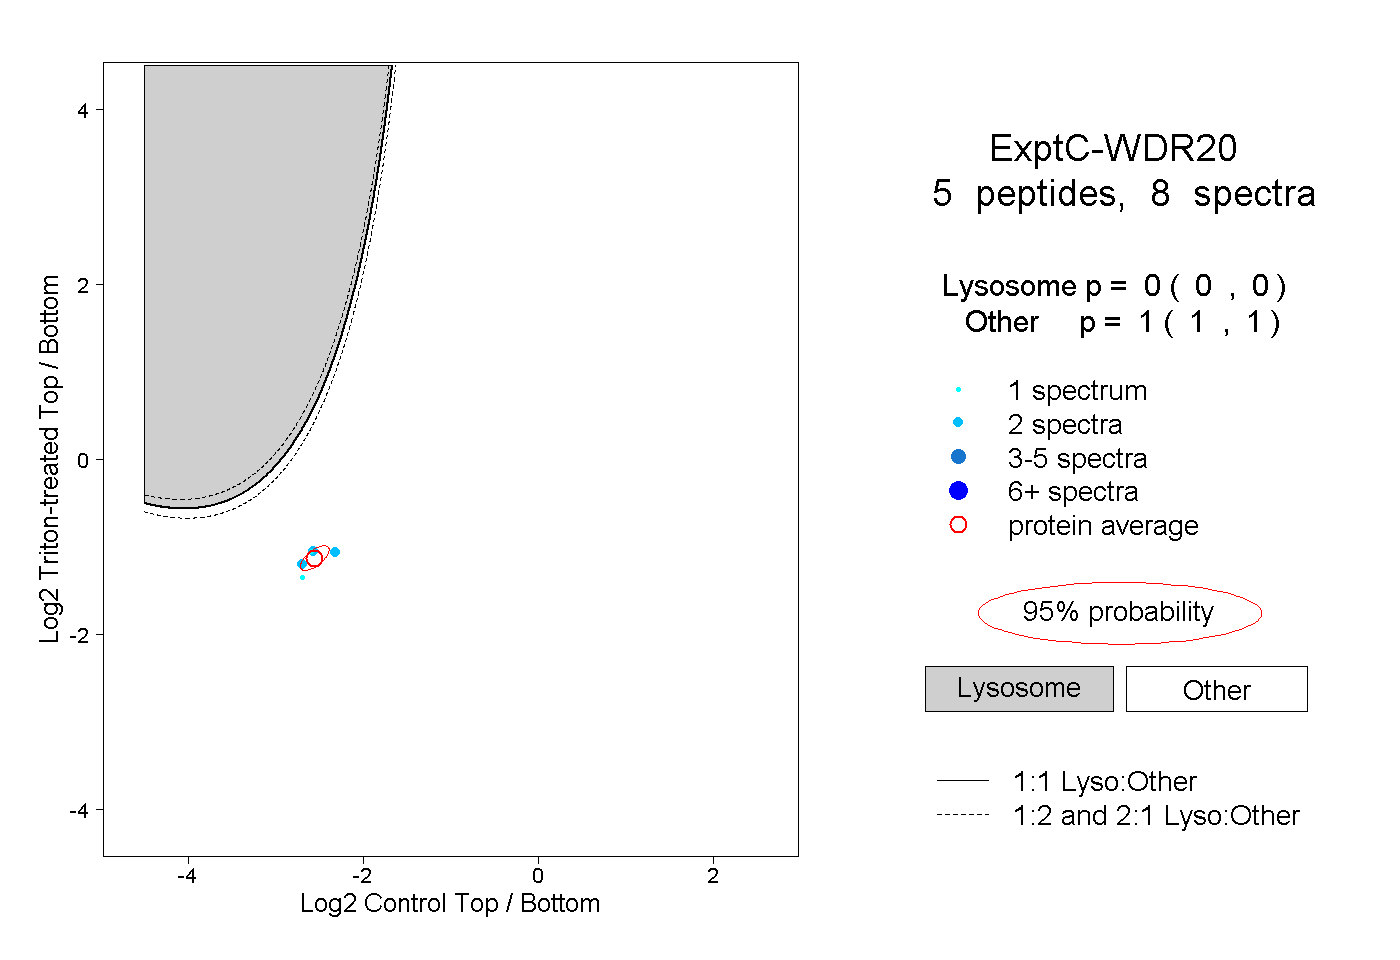
0.000 | 0.000
1.000 | 1.000
1peptide
spectra
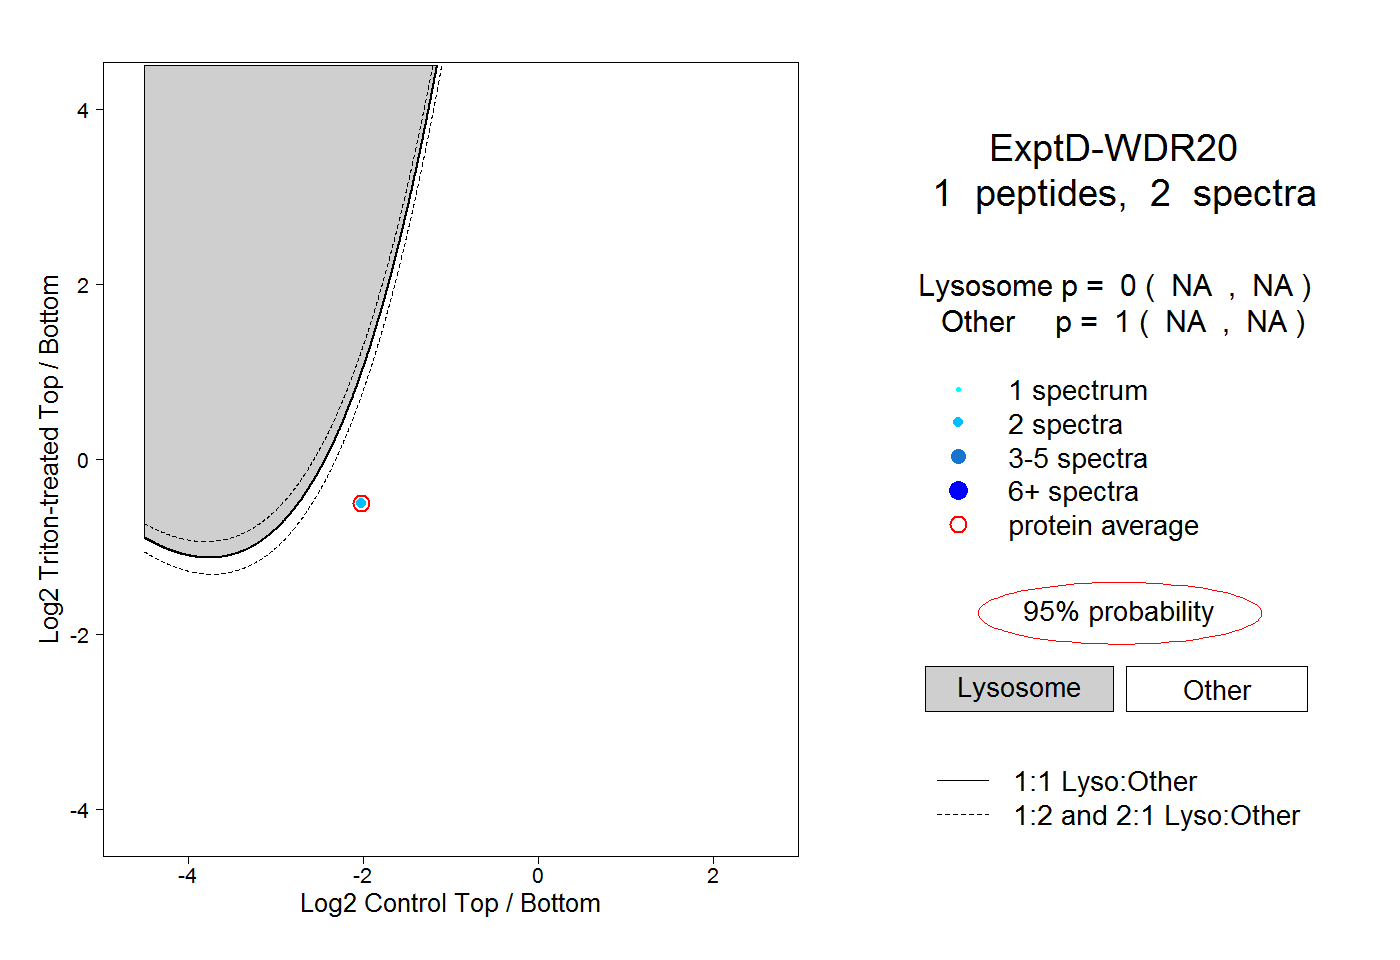
NA | NA
NA | NA