 6
6peptides
spectra
0.000 | 0.000
0.000 | 0.014
0.119 | 0.174
0.000 | 0.007
0.064 | 0.152
0.542 | 0.649
0.118 | 0.145
0.000 | 0.000
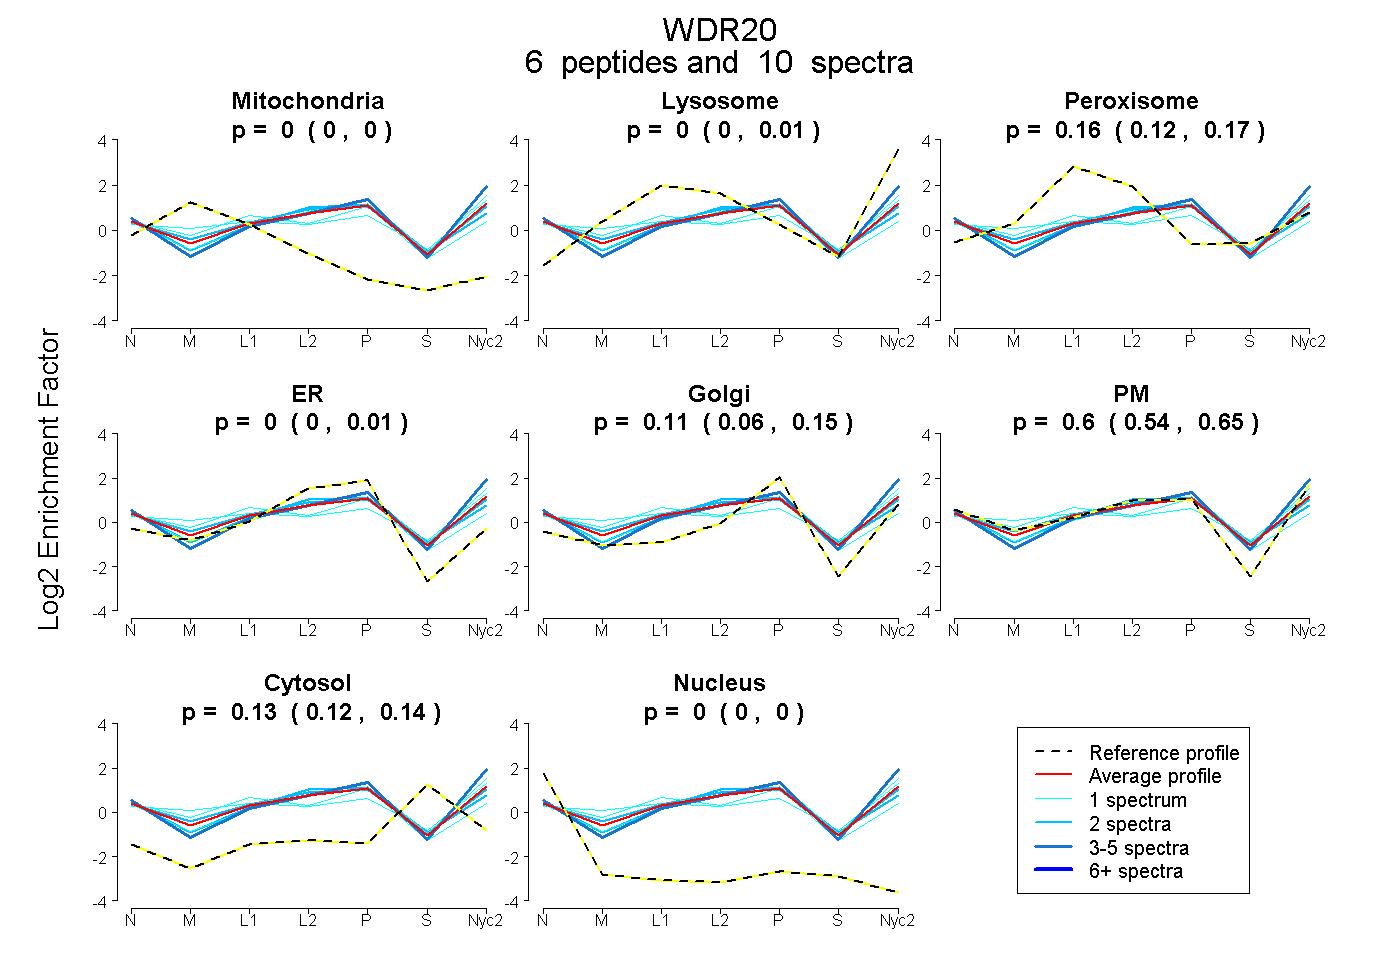
| Plot | Mito | Lyso | Perox | ER | Golgi | PM | Cytosol | Nucleus | |||||
| Expt A |
6 peptides |
10 spectra |
|
0.000 0.000 | 0.000 |
0.000 0.000 | 0.014 |
0.155 0.119 | 0.174 |
0.000 0.000 | 0.007 |
0.114 0.064 | 0.152 |
0.600 0.542 | 0.649 |
0.131 0.118 | 0.145 |
0.000 0.000 | 0.000 |
| 1 spectrum, TLGTSLCPR | 0.000 | 0.097 | 0.012 | 0.000 | 0.084 | 0.656 | 0.152 | 0.000 | ||
| 3 spectra, VPFNSQGSNPVR | 0.000 | 0.089 | 0.000 | 0.000 | 0.061 | 0.729 | 0.121 | 0.000 | ||
| 1 spectrum, ELYFYIYK | 0.025 | 0.102 | 0.120 | 0.000 | 0.000 | 0.577 | 0.176 | 0.000 | ||
| 1 spectrum, MEDVPLLEPLICK | 0.000 | 0.000 | 0.388 | 0.000 | 0.447 | 0.100 | 0.000 | 0.064 | ||
| 2 spectra, LCFNVGR | 0.000 | 0.000 | 0.215 | 0.014 | 0.128 | 0.525 | 0.117 | 0.000 | ||
| 2 spectra, FLACVSQDGFLR | 0.000 | 0.000 | 0.115 | 0.199 | 0.000 | 0.513 | 0.174 | 0.000 |
| Plot | Lyso | Other | |||||||||||
| Expt C |
5 peptides |
8 spectra |
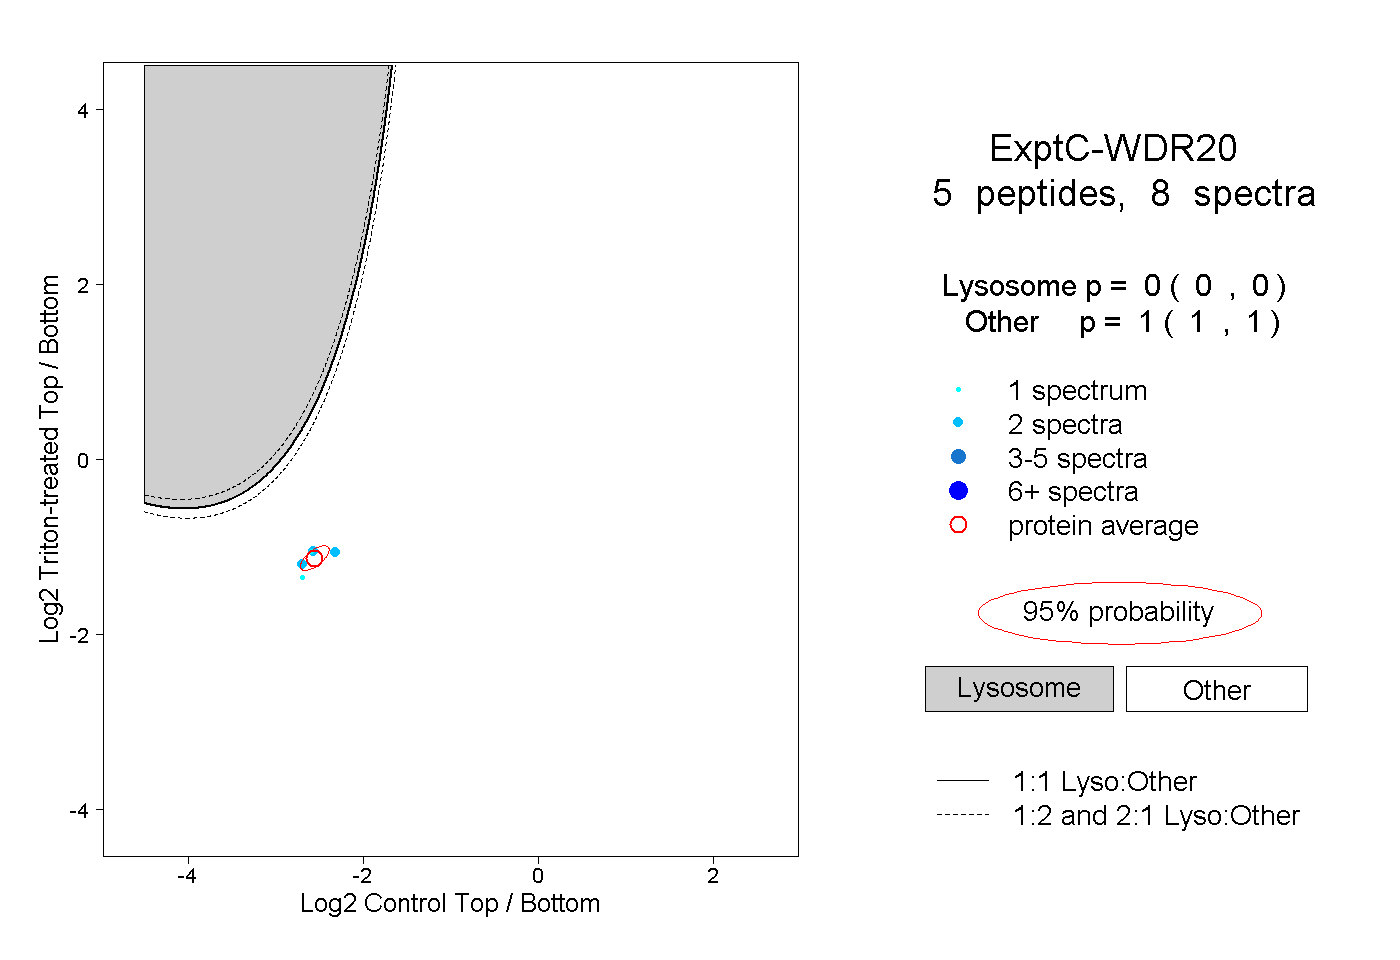 |
0.000 0.000 | 0.000 |
1.000 1.000 | 1.000 |
||||||||
| Plot | Lyso | Other | |||||||||||
| Expt D |
1 peptide |
2 spectra |
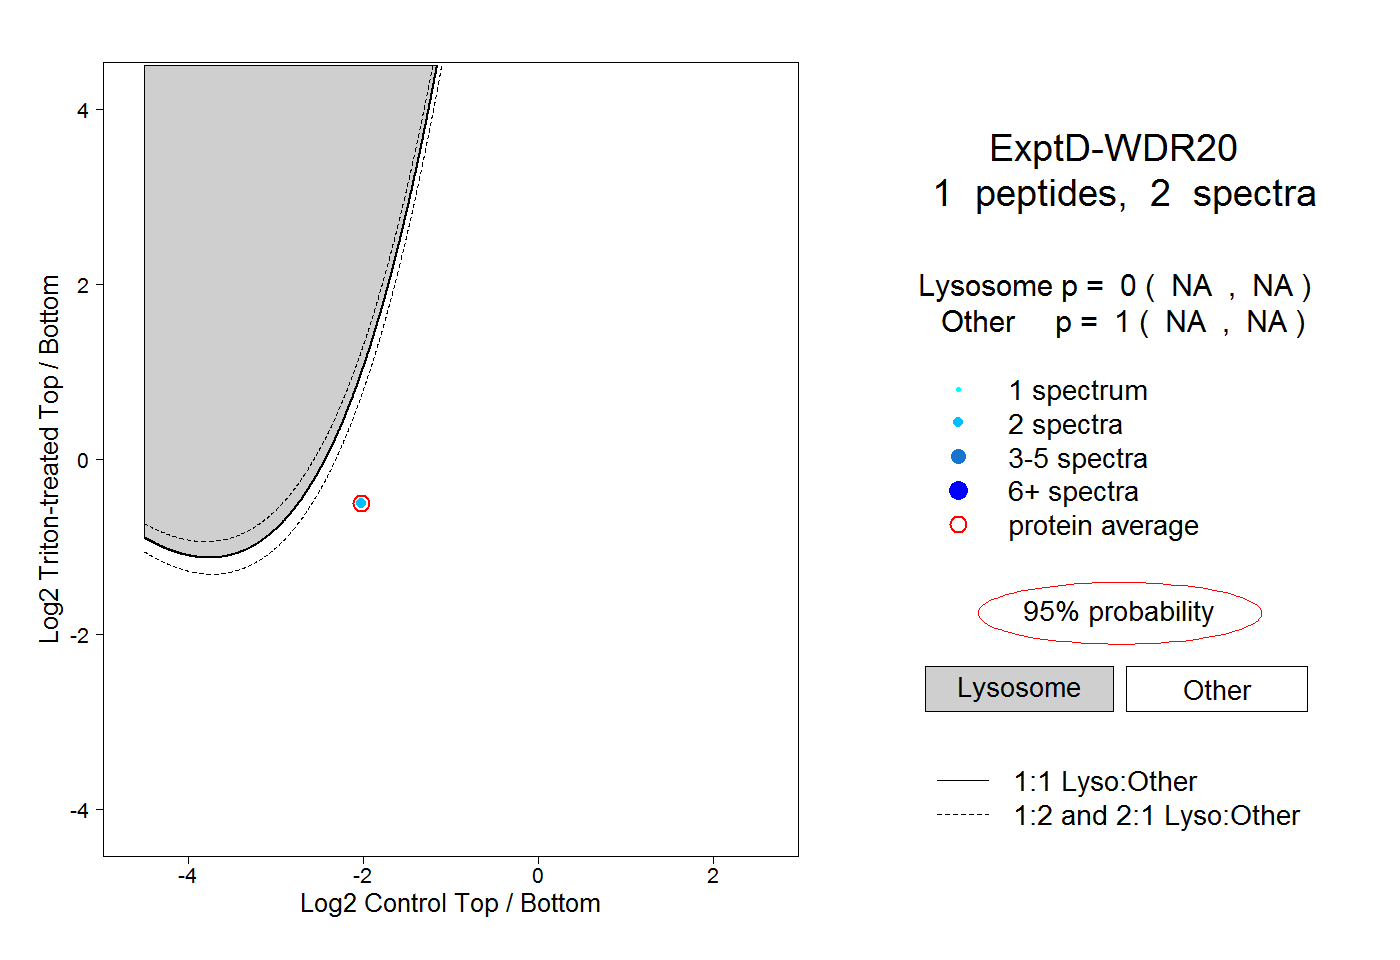 |
0.000 NA | NA |
1.000 NA | NA |