 12
12peptides
spectra
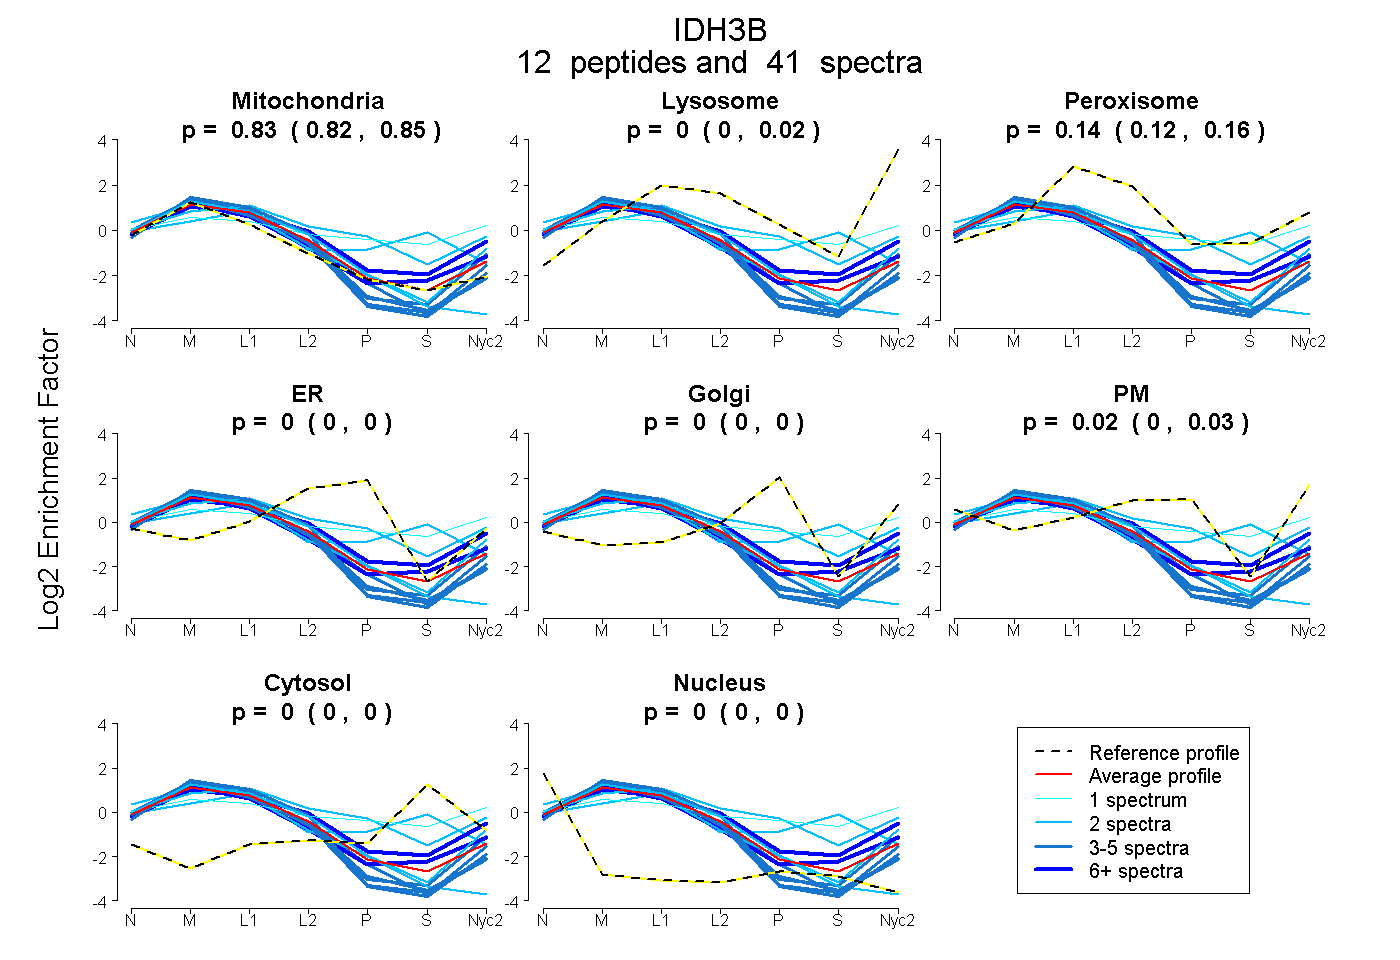
0.824 | 0.846
0.000 | 0.023
0.119 | 0.156
0.000 | 0.000
0.000 | 0.000
0.000 | 0.033
0.000 | 0.000
0.000 | 0.000
4peptides
spectra
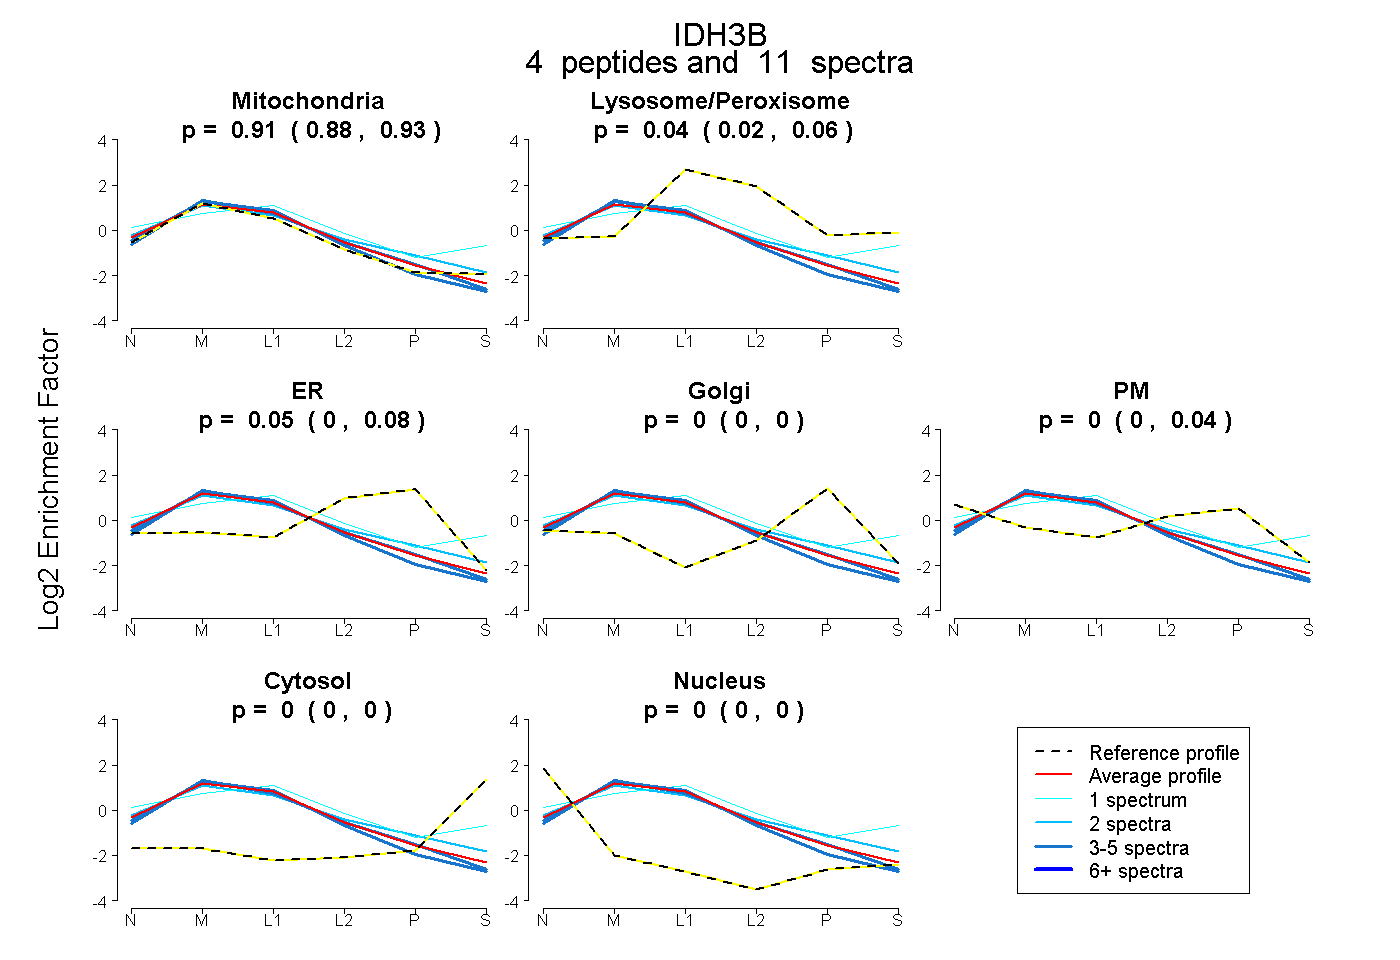
0.876 | 0.931
0.015 | 0.064
0.000 | 0.077
0.000 | 0.000
0.000 | 0.041
0.000 | 0.000
0.000 | 0.000
17peptides
spectra
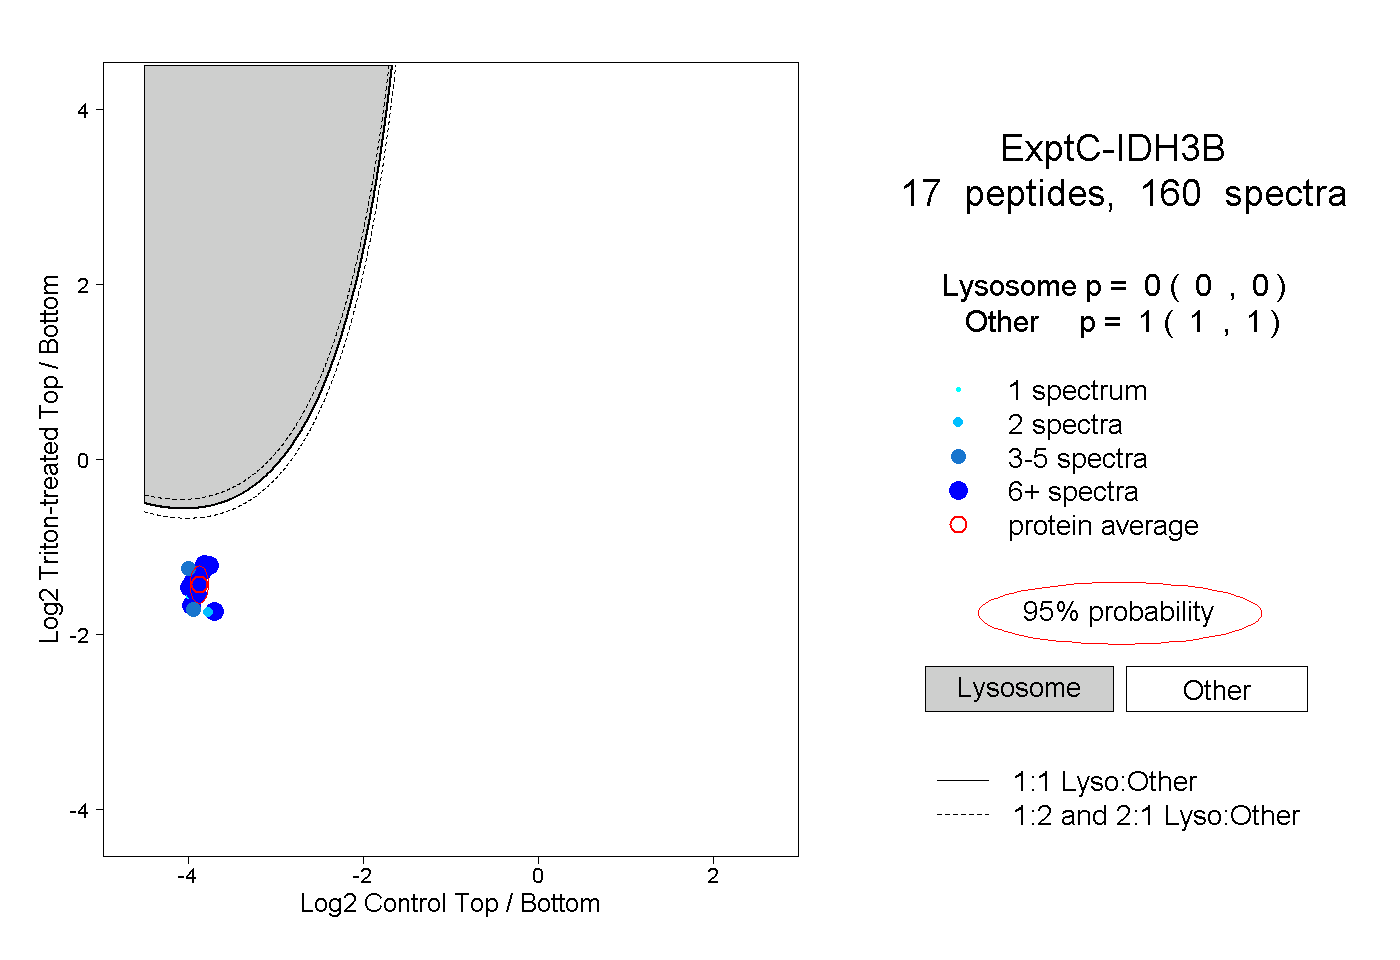
0.000 | 0.000
1.000 | 1.000
7peptides
spectra
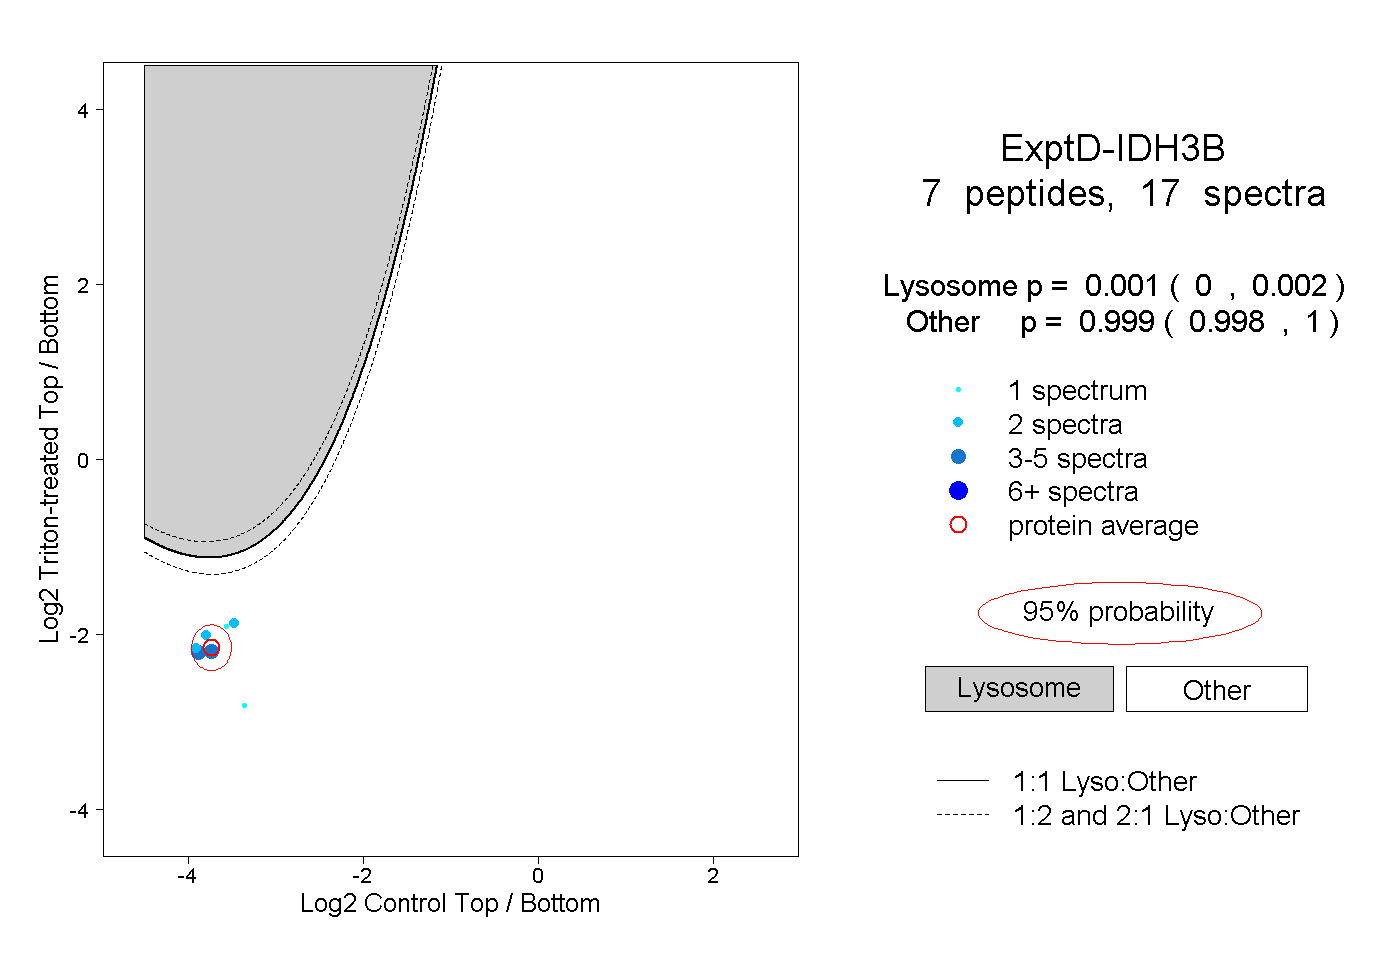
0.000 | 0.002
0.998 | 1.000