 12
12peptides
spectra
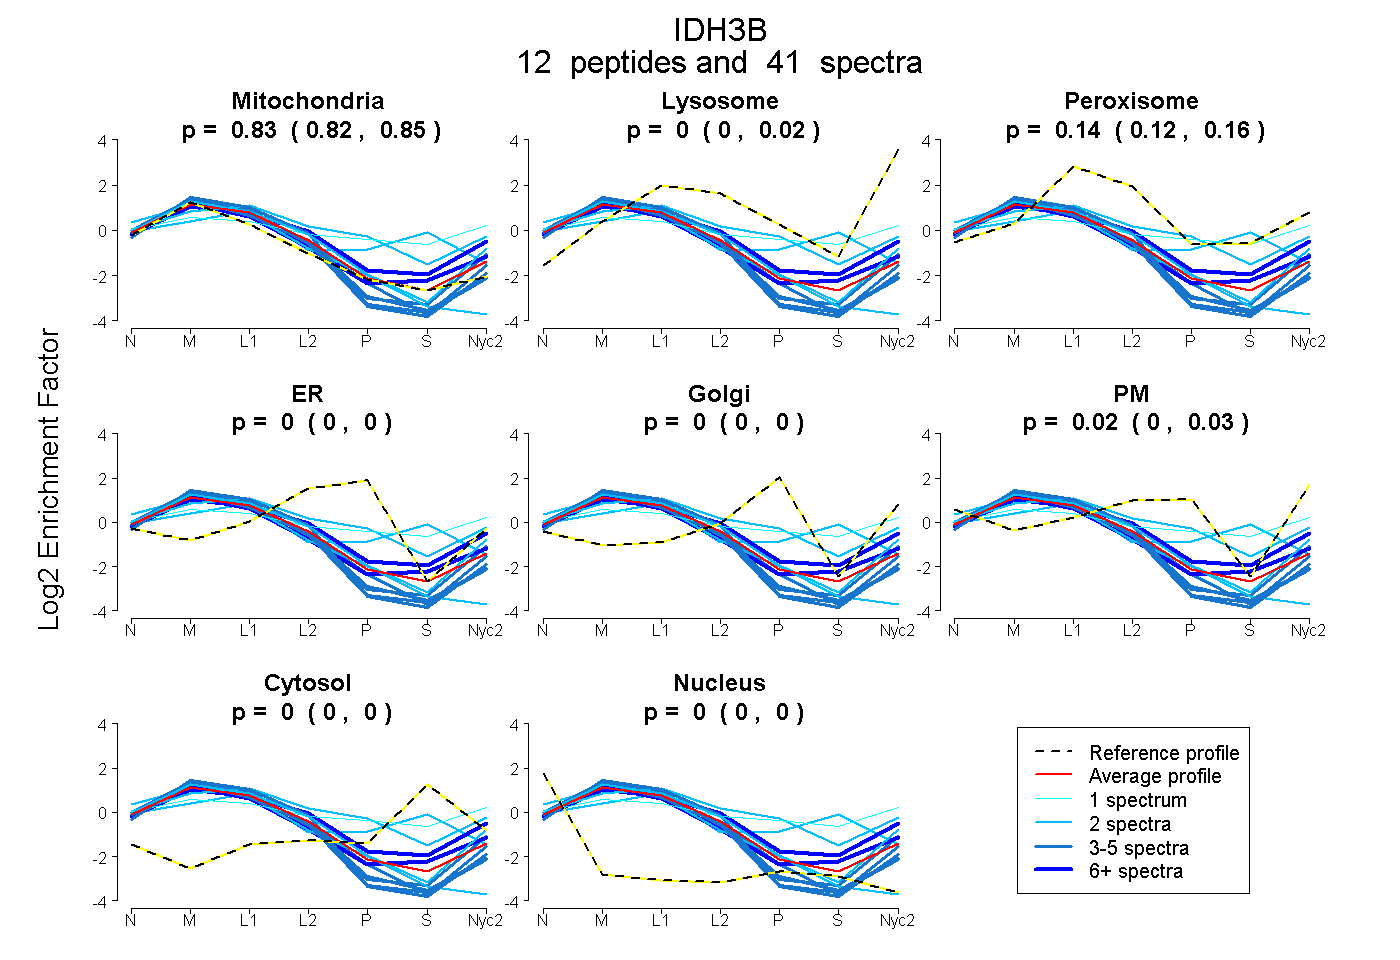
0.824 | 0.846
0.000 | 0.023
0.119 | 0.156
0.000 | 0.000
0.000 | 0.000
0.000 | 0.033
0.000 | 0.000
0.000 | 0.000
| Plot | Mito | Lyso | Perox | ER | Golgi | PM | Cytosol | Nucleus | |||||
| Expt A |
12 peptides |
41 spectra |
|
0.835 0.824 | 0.846 |
0.003 0.000 | 0.023 |
0.144 0.119 | 0.156 |
0.000 0.000 | 0.000 |
0.000 0.000 | 0.000 |
0.019 0.000 | 0.033 |
0.000 0.000 | 0.000 |
0.000 0.000 | 0.000 |
| 8 spectra, GELASYDMQLR | 0.852 | 0.077 | 0.067 | 0.000 | 0.000 | 0.000 | 0.005 | 0.000 | ||
| 2 spectra, VTAVHK | 0.790 | 0.135 | 0.005 | 0.000 | 0.000 | 0.070 | 0.000 | 0.000 | ||
| 3 spectra, FAFDYATK | 0.940 | 0.036 | 0.000 | 0.000 | 0.000 | 0.024 | 0.000 | 0.000 | ||
| 5 spectra, HPFAQAVGR | 1.000 | 0.000 | 0.000 | 0.000 | 0.000 | 0.000 | 0.000 | 0.000 | ||
| 6 spectra, HNNLDLVIIR | 0.652 | 0.162 | 0.158 | 0.000 | 0.000 | 0.011 | 0.000 | 0.017 | ||
| 2 spectra, GVIECLK | 0.932 | 0.000 | 0.000 | 0.000 | 0.000 | 0.000 | 0.000 | 0.068 | ||
| 4 spectra, LDLFANVVHVK | 1.000 | 0.000 | 0.000 | 0.000 | 0.000 | 0.000 | 0.000 | 0.000 | ||
| 3 spectra, DMGGYSTTTDFIK | 0.921 | 0.079 | 0.000 | 0.000 | 0.000 | 0.000 | 0.000 | 0.000 | ||
| 1 spectrum, VAIIGK | 0.286 | 0.077 | 0.184 | 0.000 | 0.000 | 0.255 | 0.197 | 0.000 | ||
| 2 spectra, SVIGHLHPHGG | 0.381 | 0.000 | 0.362 | 0.000 | 0.140 | 0.117 | 0.000 | 0.000 | ||
| 3 spectra, VEGAFPVTMLPGDGVGPELMHAVK | 0.990 | 0.000 | 0.010 | 0.000 | 0.000 | 0.000 | 0.000 | 0.000 | ||
| 2 spectra, EQTEGEYSSLEHESAR | 0.436 | 0.000 | 0.268 | 0.000 | 0.000 | 0.000 | 0.296 | 0.000 |
| Plot | Mito | Lyso or Perox | ER | Golgi | PM | Cytosol | Nucleus | ||||||
| Expt B |
4 peptides |
11 spectra |
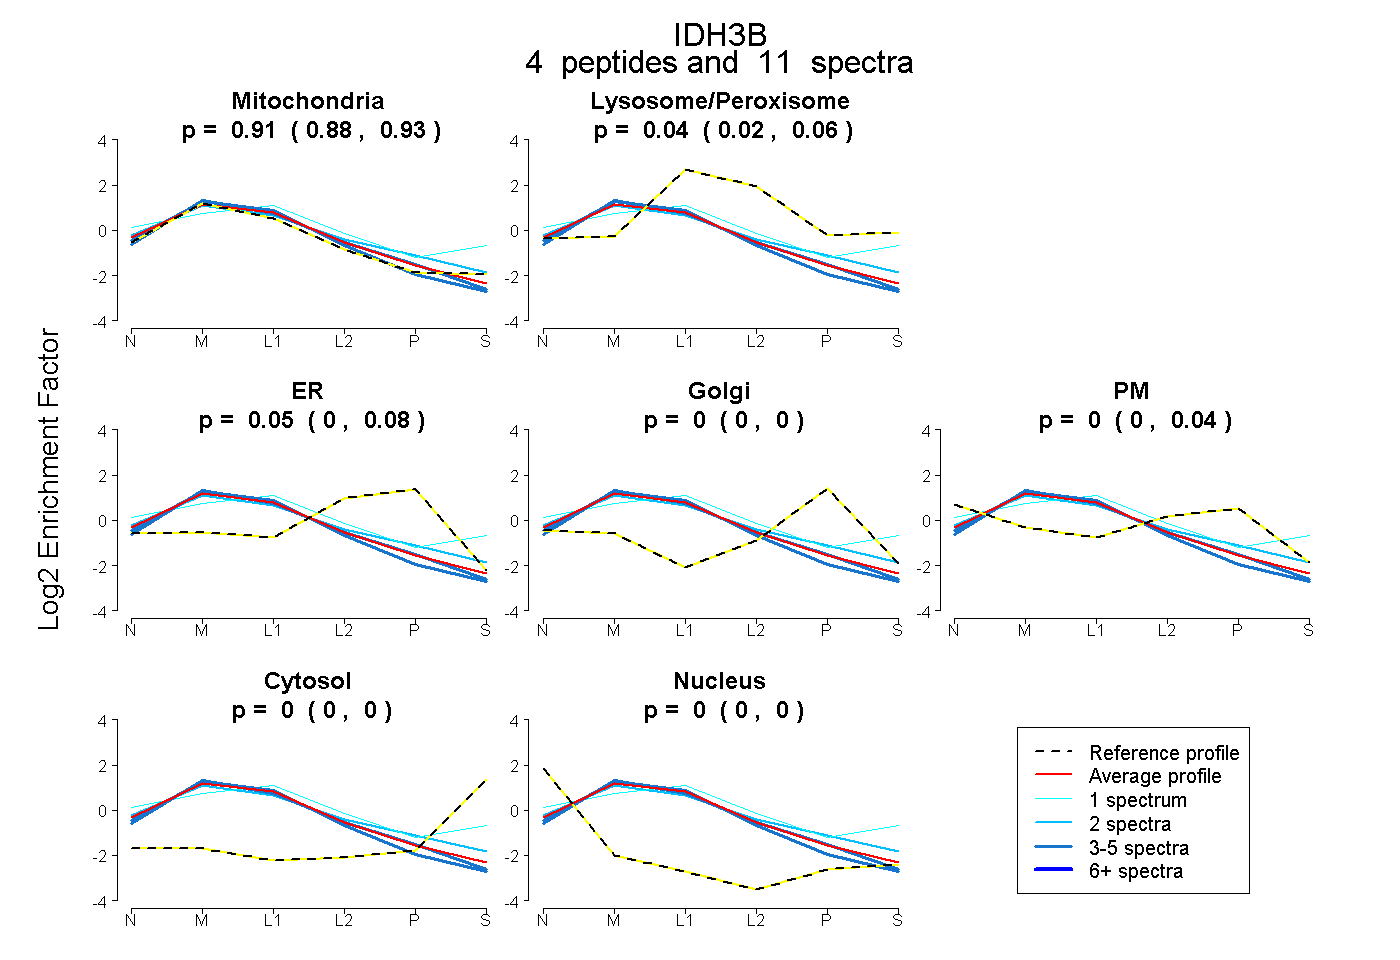 |
0.909 0.876 | 0.931 |
0.040 0.015 | 0.064 |
0.051 0.000 | 0.077 |
0.000 0.000 | 0.000 |
0.000 0.000 | 0.041 |
0.000 0.000 | 0.000 |
0.000 0.000 | 0.000 |
|||
| Plot | Lyso | Other | |||||||||||
| Expt C |
17 peptides |
160 spectra |
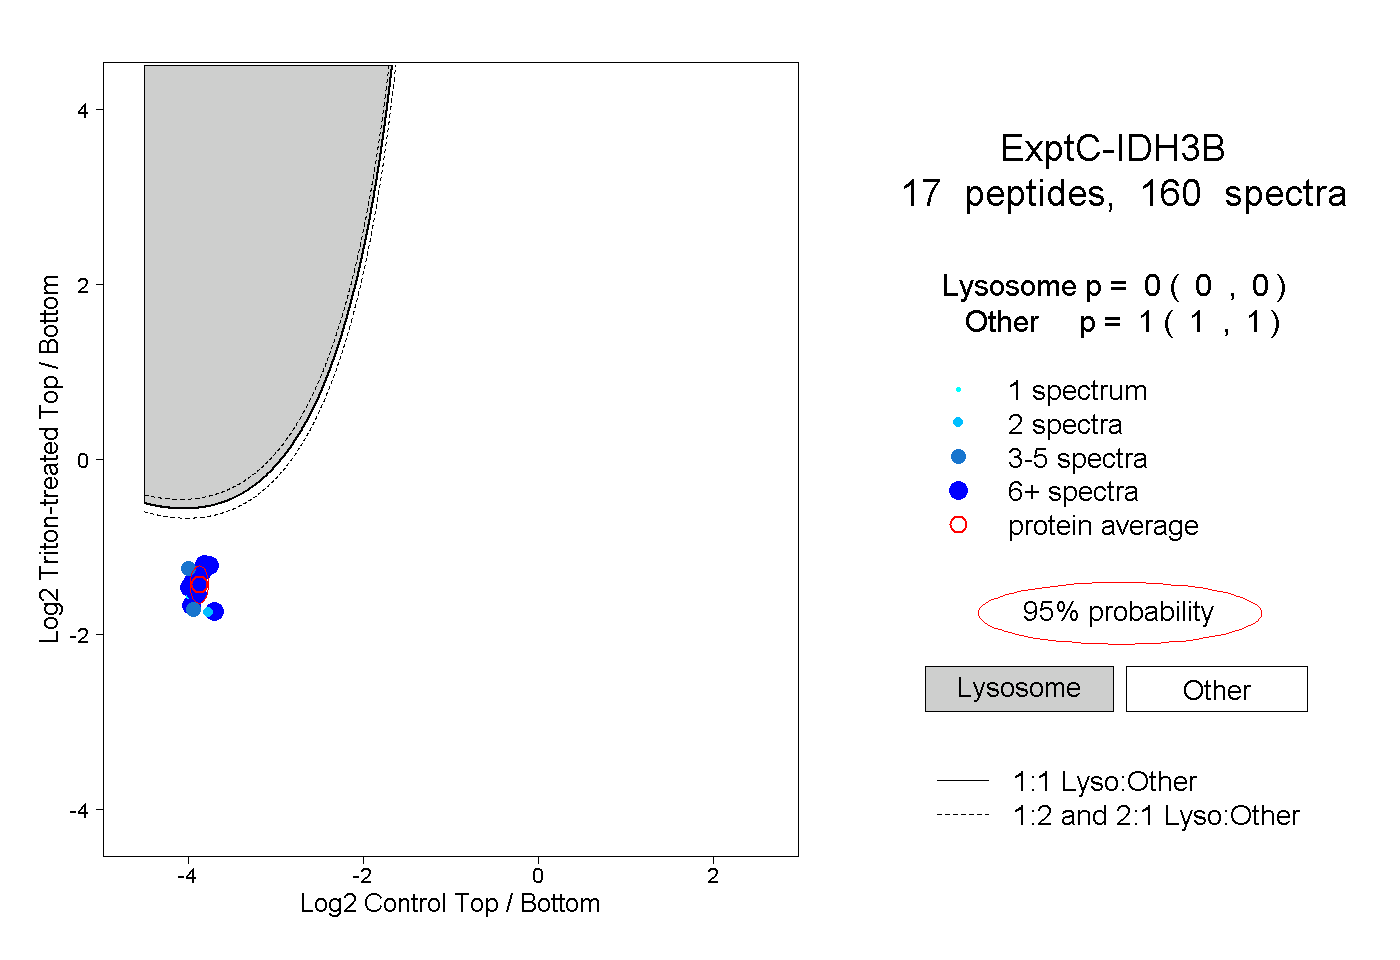 |
0.000 0.000 | 0.000 |
1.000 1.000 | 1.000 |
||||||||
| Plot | Lyso | Other | |||||||||||
| Expt D |
7 peptides |
17 spectra |
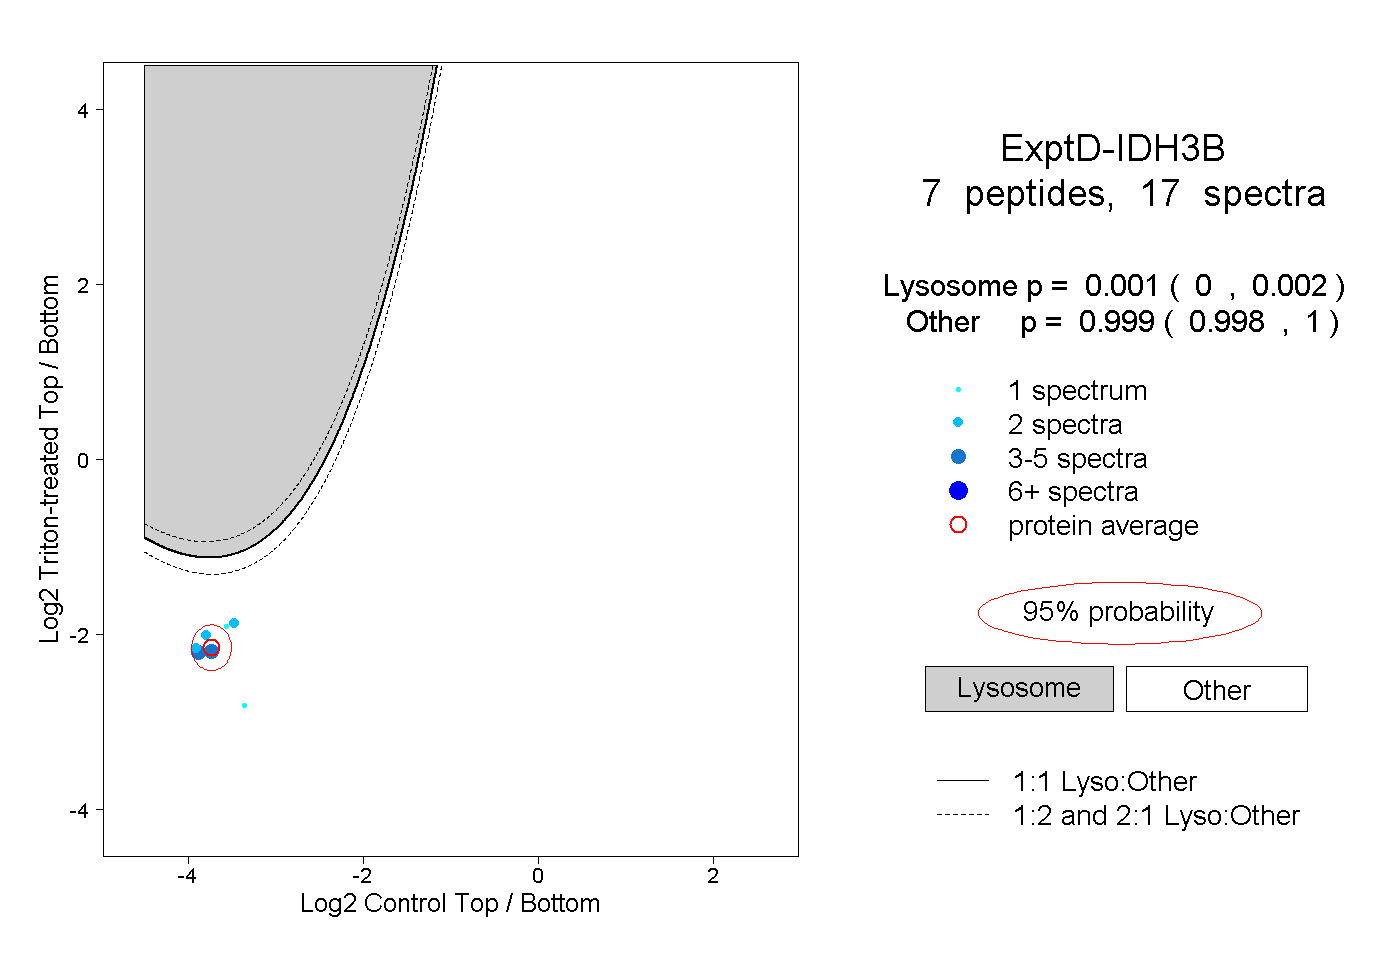 |
0.001 0.000 | 0.002 |
0.999 0.998 | 1.000 |