 3
3peptides
spectra
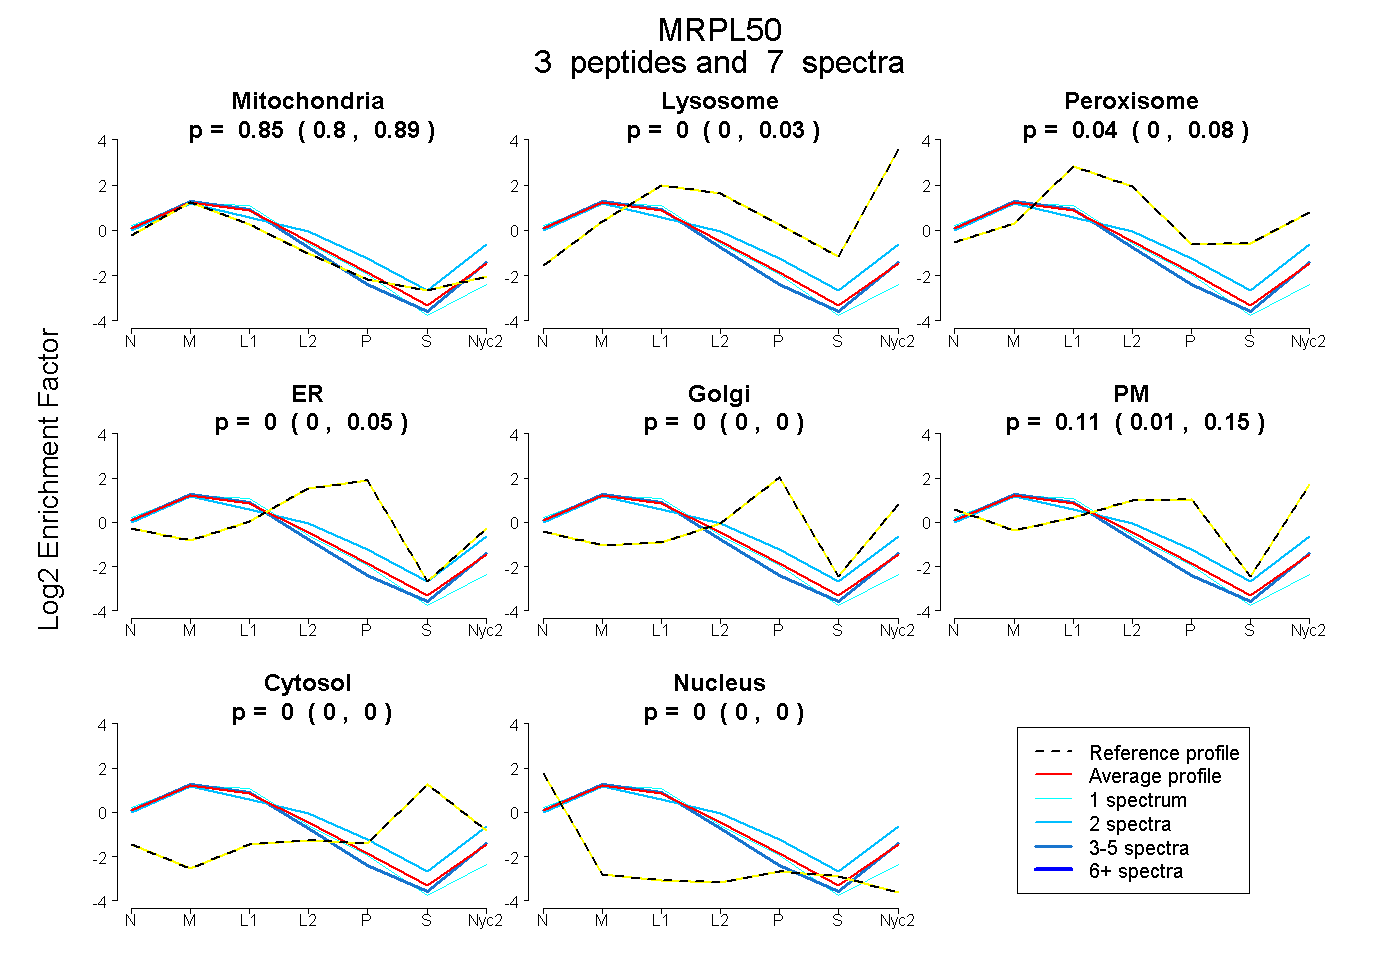
0.804 | 0.888
0.000 | 0.031
0.000 | 0.079
0.000 | 0.050
0.000 | 0.000
0.014 | 0.154
0.000 | 0.000
0.000 | 0.000
3peptides
spectra

0.888 | 1.000
0.000 | 0.023
0.000 | 0.086
0.000 | 0.040
0.000 | 0.027
0.000 | 0.000
0.000 | 0.000
5peptides
spectra
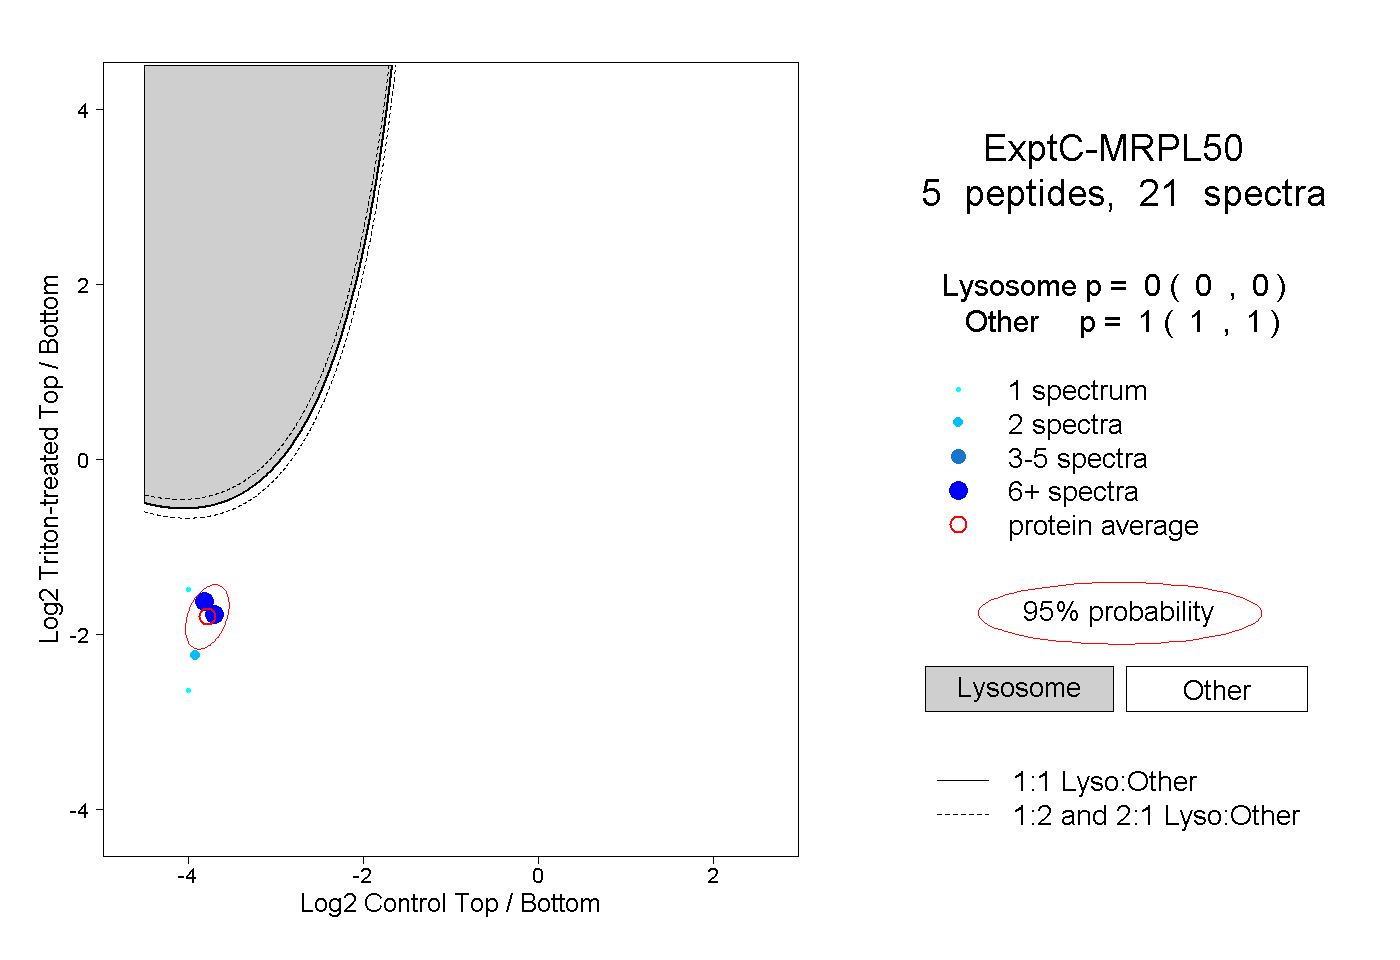
0.000 | 0.000
1.000 | 1.000
1peptide
spectra

NA | NA
NA | NA